
Description of coastal tourism:
Coastal tourism Gross Domestic Product is the total measure (in billions of dollars) of goods and services provided from tourism along the coast. U.S. coasts are host to a multitude of travel, tourism, and recreation activities. These provide social and economic benefits as well as impact the environment. As more and more communities turn to tourism for economic development, it becomes crucial to develop a sustainable tourism industry that is good for communities, the environment, and society more broadly. To accomplish this, we need data on the social and economic impacts of recreation and tourism, and its impacts on natural resources. We present the annual total change (in billions of dollars) of goods and services provided from tourism in the Gulf of Mexico, Mid-Atlantic, Northeast, Pacific Islands, Southeast, and California Current regions.
Data:
Coastal Tourism GDP data was taken from NOAA’s Office of Coastal Management Economics National Ocean Watch custom report building tool, with contextual data taken from the 2019 NOAA Report on the U.S. Ocean and Great Lakes Economy: Regional and State Profiles. Growth was estimated by subtracting the previous year’s Coastal Tourism GDP from the current year’s Coastal Tourism GDP, then dividing by the previous year’s Coastal Tourism GDP to present a percentage. All data was deflated to 2012 constant dollars using the Bureau of Economic Analysis’ chained dollar methodology.
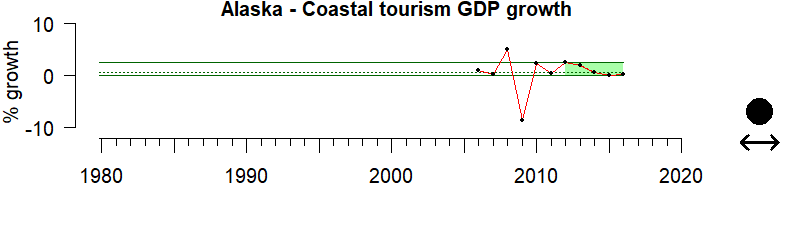
Alaska
Description of time series:
The growth in the value of Alaska’s coastal tourism is relatively steady, with no clear trend and the last 5 years of growth not different from historical patterns.
Description of gauge:
The value of Alaska’s coastal tourism grew at a rate of 0.1% between 2015-2016, less than the rest of the regional economy’s growth of 8.4%, but more than other ocean sectors which saw a 14% decline over that same time period.
Description of Coastal Tourism:
Coastal tourism Gross Domestic Product is the total measure (in billions of dollars) of goods and services provided from tourism along the coast. U.S. coasts are host to a multitude of travel, tourism, and recreation activities. These provide social and economic benefits as well as impact the environment. As more and more communities turn to tourism for economic development, it becomes crucial to develop a sustainable tourism industry that is good for communities, the environment, and society more broadly. To accomplish this, we need data on the social and economic impacts of recreation and tourism, and its impacts on natural resources. We present the annual total change (in billions of dollars) of goods and services provided from tourism in the Gulf of Mexico, Mid-Atlantic, Northeast, Pacific Islands, Southeast, and California Current regions.
Extreme Gauge values:
A value of zero on the gauge means that the average coastal tourism over the last 5 years of data was below any annual coastal tourism level up until that point, while a value of 100 would indicate the average over that same period was above any annual coastal tourism level up until that point.
Data:
Coastal Tourism GDP data was taken from NOAA’s Office of Coastal Management Economics National Ocean Watch custom report building tool, with contextual data taken from the 2019 NOAA Report on the U.S. Ocean and Great Lakes Economy: Regional and State Profiles. Growth was estimated by subtracting the previous year’s Coastal Tourism GDP from the current year’s Coastal Tourism GDP, then dividing by the previous year’s Coastal Tourism GDP to present a percentage. All data was deflated to 2012 constant dollars using the Bureau of Economic Analysis’ chained dollar methodology.
Hawaii-Pacific Islands

Description of time series:
The growth in the value of Hawaii’s coastal tourism varies considerably across time, although there is no clear trend and the last 5 years of growth is not different from historical patterns.
Description of gauge:
The value of Hawaii’s coastal tourism grew at a rate of 1.3% between 2015-2016, less than both the rest of the regional economy’s growth of 3.5% and other ocean sectors growth of 2.4%.
Description of Coastal Tourism:
Coastal tourism Gross Domestic Product is the total measure (in billions of dollars) of goods and services provided from tourism along the coast. U.S. coasts are host to a multitude of travel, tourism, and recreation activities. These provide social and economic benefits as well as impact the environment. As more and more communities turn to tourism for economic development, it becomes crucial to develop a sustainable tourism industry that is good for communities, the environment, and society more broadly. To accomplish this, we need data on the social and economic impacts of recreation and tourism, and its impacts on natural resources. We present the annual total change (in billions of dollars) of goods and services provided from tourism in the Gulf of Mexico, Mid-Atlantic, Northeast, Pacific Islands, Southeast, and California Current regions.
Extreme Gauge values:
A value of zero on the gauge means that the average coastal tourism over the last 5 years of data was below any annual coastal tourism level up until that point, while a value of 100 would indicate the average over that same period was above any annual coastal tourism level up until that point.
Data:
Coastal Tourism GDP data was taken from NOAA’s Office of Coastal Management Economics National Ocean Watch custom report building tool, with contextual data taken from the 2019 NOAA Report on the U.S. Ocean and Great Lakes Economy: Regional and State Profiles. Growth was estimated by subtracting the previous year’s Coastal Tourism GDP from the current year’s Coastal Tourism GDP, then dividing by the previous year’s Coastal Tourism GDP to present a percentage. All data was deflated to 2012 constant dollars using the Bureau of Economic Analysis’ chained dollar methodology.
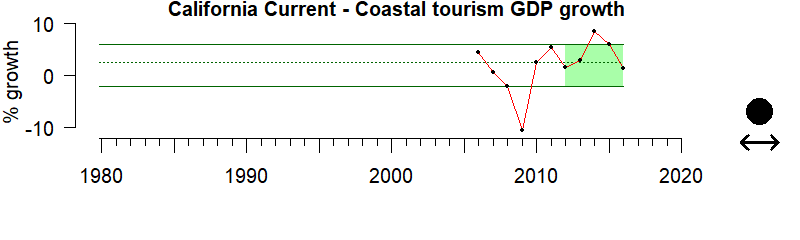
California Current
Description of time series:
The growth in the value of coastal tourism within the California Current ecosystem varies considerably across time, although there is no clear trend and the last 5 years of growth is not different from historical patterns.
Description of gauge:
The value of coastal tourism within the California Current ecosystem grew at a rate of 1.3% between 2015-2016, less than the rest of the regional economy’s growth of 3.9%, but more than other ocean sectors which grew only 0.9% over that same time period.
Description of Coastal Tourism:
Coastal tourism Gross Domestic Product is the total measure (in billions of dollars) of goods and services provided from tourism along the coast. U.S. coasts are host to a multitude of travel, tourism, and recreation activities. These provide social and economic benefits as well as impact the environment. As more and more communities turn to tourism for economic development, it becomes crucial to develop a sustainable tourism industry that is good for communities, the environment, and society more broadly. To accomplish this, we need data on the social and economic impacts of recreation and tourism, and its impacts on natural resources. We present the annual total change (in billions of dollars) of goods and services provided from tourism in the Gulf of Mexico, Mid-Atlantic, Northeast, Pacific Islands, Southeast, and California Current regions.
Extreme Gauge values:
A value of zero on the gauge means that the average coastal tourism over the last 5 years of data was below any annual coastal tourism level up until that point, while a value of 100 would indicate the average over that same period was above any annual coastal tourism level up until that point.
Data:
Coastal Tourism GDP data was taken from NOAA’s Office of Coastal Management Economics National Ocean Watch custom report building tool, with contextual data taken from the 2019 NOAA Report on the U.S. Ocean and Great Lakes Economy: Regional and State Profiles. Growth was estimated by subtracting the previous year’s Coastal Tourism GDP from the current year’s Coastal Tourism GDP, then dividing by the previous year’s Coastal Tourism GDP to present a percentage. All data was deflated to 2012 constant dollars using the Bureau of Economic Analysis’ chained dollar methodology.
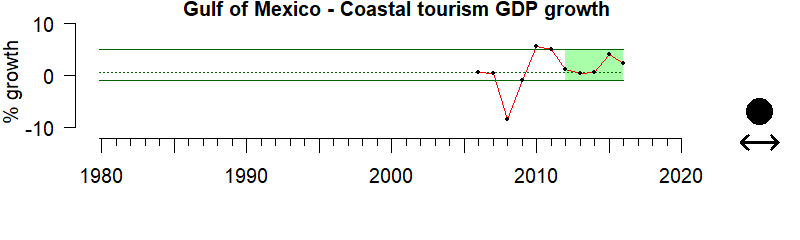
Gulf of Mexico
Description of time series:
The growth in the value of coastal tourism along the Gulf of Mexico varies considerably across time, with an upward trend although the last 5 years of growth shows no difference from historical patterns.
Description of gauge:
The value of coastal tourism along the Gulf of Mexico grew at a rate of 2.2% between 2015-2016, faster than the rest of the regional economy, which grew 0.2%, and other ocean sectors, which decreased 13.5% over that same time period.
Description of Coastal Tourism:
Coastal tourism Gross Domestic Product is the total measure (in billions of dollars) of goods and services provided from tourism along the coast. U.S. coasts are host to a multitude of travel, tourism, and recreation activities. These provide social and economic benefits as well as impact the environment. As more and more communities turn to tourism for economic development, it becomes crucial to develop a sustainable tourism industry that is good for communities, the environment, and society more broadly. To accomplish this, we need data on the social and economic impacts of recreation and tourism, and its impacts on natural resources. We present the annual total change (in billions of dollars) of goods and services provided from tourism in the Gulf of Mexico, Mid-Atlantic, Northeast, Pacific Islands, Southeast, and California Current regions.
Extreme Gauge values:
A value of zero on the gauge means that the average coastal tourism over the last 5 years of data was below any annual coastal tourism level up until that point, while a value of 100 would indicate the average over that same period was above any annual coastal tourism level up until that point.
Data:
Coastal Tourism GDP data was taken from NOAA’s Office of Coastal Management Economics National Ocean Watch custom report building tool, with contextual data taken from the 2019 NOAA Report on the U.S. Ocean and Great Lakes Economy: Regional and State Profiles. Growth was estimated by subtracting the previous year’s Coastal Tourism GDP from the current year’s Coastal Tourism GDP, then dividing by the previous year’s Coastal Tourism GDP to present a percentage. All data was deflated to 2012 constant dollars using the Bureau of Economic Analysis’ chained dollar methodology.
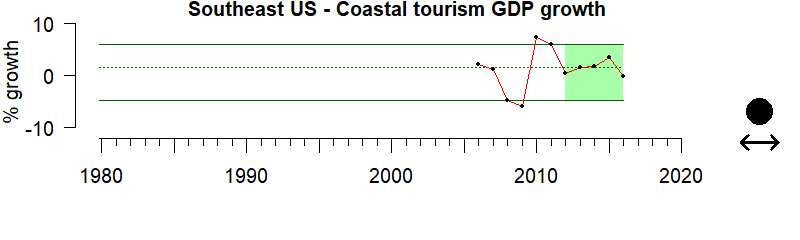
Southeast
Description of time series:
The growth in the value of coastal tourism in the Southeast varies considerably across time, with no clear trend and the last 5 years of growth not different from historical patterns.
Description of gauge:
The value of coastal tourism in the Southeast grew at a rate of 0.1% between 2015-2016, less than both the rest of the regional economy, which grew 2.9%, and other ocean sectors, which grew 2.7% over that same time period.
Description of Coastal Tourism:
Coastal tourism Gross Domestic Product is the total measure (in billions of dollars) of goods and services provided from tourism along the coast. U.S. coasts are host to a multitude of travel, tourism, and recreation activities. These provide social and economic benefits as well as impact the environment. As more and more communities turn to tourism for economic development, it becomes crucial to develop a sustainable tourism industry that is good for communities, the environment, and society more broadly. To accomplish this, we need data on the social and economic impacts of recreation and tourism, and its impacts on natural resources. We present the annual total change (in billions of dollars) of goods and services provided from tourism in the Gulf of Mexico, Mid-Atlantic, Northeast, Pacific Islands, Southeast, and California Current regions.
Extreme Gauge values:
A value of zero on the gauge means that the average coastal tourism over the last 5 years of data was below any annual coastal tourism level up until that point, while a value of 100 would indicate the average over that same period was above any annual coastal tourism level up until that point.
Data:
Coastal Tourism GDP data was taken from NOAA’s Office of Coastal Management Economics National Ocean Watch custom report building tool, with contextual data taken from the 2019 NOAA Report on the U.S. Ocean and Great Lakes Economy: Regional and State Profiles. Growth was estimated by subtracting the previous year’s Coastal Tourism GDP from the current year’s Coastal Tourism GDP, then dividing by the previous year’s Coastal Tourism GDP to present a percentage. All data was deflated to 2012 constant dollars using the Bureau of Economic Analysis’ chained dollar methodology.
Northeast
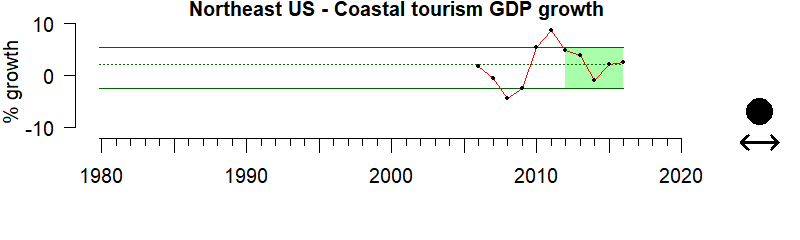
Description of time series:
The growth in the value of coastal tourism in the Northeast varies considerably across time, with no clear trend and the last 5 years of growth not different from historical patterns.
Description of gauge:
The growth in value of coastal tourism in the Northeast was mixed, with states north of New York seeing faster growth than both the regional economy and other ocean sectors, while states between New York and North Carolina seeing a decrease in GDP. Nevertheless, coastal tourism weathered recent economic downturns better than the regional economy as a whole.
Description of Coastal Tourism:
Coastal tourism Gross Domestic Product is the total measure (in billions of dollars) of goods and services provided from tourism along the coast. U.S. coasts are host to a multitude of travel, tourism, and recreation activities. These provide social and economic benefits as well as impact the environment. As more and more communities turn to tourism for economic development, it becomes crucial to develop a sustainable tourism industry that is good for communities, the environment, and society more broadly. To accomplish this, we need data on the social and economic impacts of recreation and tourism, and its impacts on natural resources. We present the annual total change (in billions of dollars) of goods and services provided from tourism in the Gulf of Mexico, Mid-Atlantic, Northeast, Pacific Islands, Southeast, and California Current regions.
Extreme Gauge values:
A value of zero on the gauge means that the average coastal tourism over the last 5 years of data was below any annual coastal tourism level up until that point, while a value of 100 would indicate the average over that same period was above any annual coastal tourism level up until that point.
Data:
Coastal Tourism GDP data was taken from NOAA’s Office of Coastal Management Economics National Ocean Watch custom report building tool, with contextual data taken from the 2019 NOAA Report on the U.S. Ocean and Great Lakes Economy: Regional and State Profiles. Growth was estimated by subtracting the previous year’s Coastal Tourism GDP from the current year’s Coastal Tourism GDP, then dividing by the previous year’s Coastal Tourism GDP to present a percentage. All data was deflated to 2012 constant dollars using the Bureau of Economic Analysis’ chained dollar methodology.

Resources
NOAA Economic National Ocean Watch data base
The Economics: National Ocean Watch (ENOW) data set features time-series data focused on the six economic sectors that are dependent on the oceans and Great Lakes. ENOW is available for counties, states, regions, and the nation in a wide variety of formats.