Description of forage fish:
Forage fish or otherwise known as small pelagics are fish and invertebrates (like squids) that inhabit - the pelagic zone - the open ocean. The number and distribution of pelagic fish vary regionally, depending on multiple physical and ecological factors i.e. the availability of light, nutrients, dissolved oxygen, temperature, salinity, predation, abundance of phytoplankton and zooplankton, etc. Small pelagics are known to exhibit “boom and bust” cycles of abundance in response to these conditions. Examples include anchovies, sardines, shad, menhaden and the fish that feed on them
Small pelagic species are often important to fisheries and serve as forage for commercially and recreationally important fish, as well as other ecosystem species (e.g. seabirds and marine mammals). They are a critical part of marine food webs and important to monitor because so many other organisms depend on them. We present the annual total biomass of small pelagics/forage fish in the Alaska, California Current, and Northeast regions, as well as selected taxa in the Gulf of Mexico region.
Data:
Data for forage fish and small pelagics were obtained from regional NOAA Integrated Ecosystem Assessment Program teams that produce indicators and Ecosystem Status Report. For more information https://www.integratedecosystemassessment.noaa.gov/
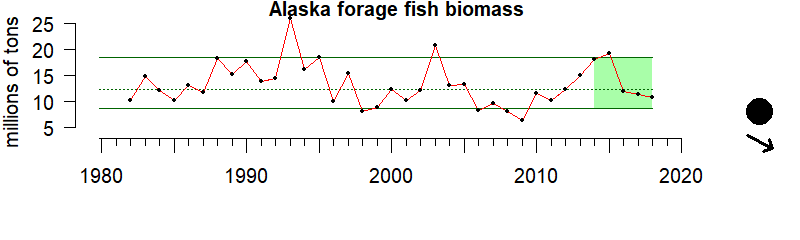
Alaska
Description of time series:
During the last five years the forage fish biomass shows a significant downward trend.
Description of gauge:
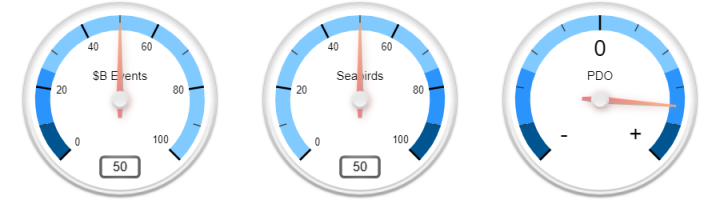
The Gauge value of 65 indicates that over the last five years, the forage fish biomass is higher than the median value.
Description of forage fish:
Forage fish or otherwise known as small pelagics are fish and invertebrates (like squids) that inhabit - the pelagic zone - the open ocean. The number and distribution of pelagic fish vary regionally, depending on multiple physical and ecological factors i.e. the availability of light, nutrients, dissolved oxygen, temperature, salinity, predation, abundance of phytoplankton and zooplankton, etc. Small pelagics are known to exhibit “boom and bust” cycles of abundance in response to these conditions. Examples include anchovies, sardines, shad, menhaden and the fish that feed on them
Small pelagic species are often important to fisheries and serve as forage for commercially and recreationally important fish, as well as other ecosystem species (e.g. seabirds and marine mammals). They are a critical part of marine food webs and important to monitor because so many other organisms depend on them. We present the annual total biomass of small pelagics/forage fish in the Alaska, California Current, and Northeast regions, as well as selected taxa in the Gulf of Mexico region.
Overall Scores means the following:
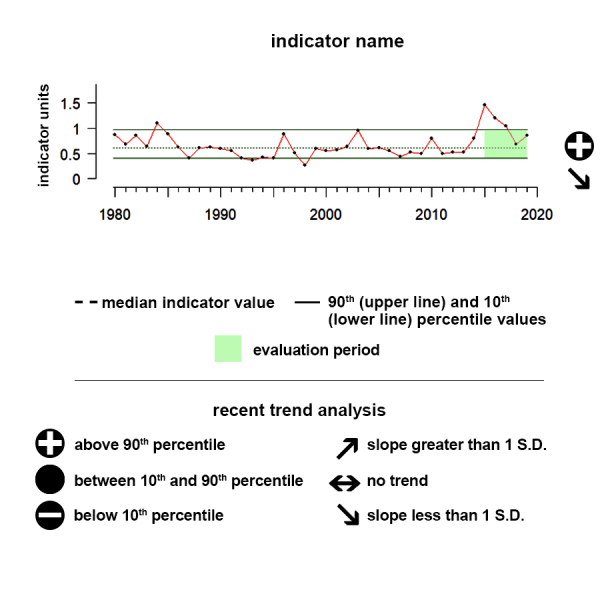
- 0 - 10: The five-year forage fish small pelagics average is very low compared to the median value.
- 10 - 25: The five-year forage fish small pelagics average is much lower than the median value.
- 25 - 50: The five-year forage fish small pelagics average is lower than the median value.
- 50: The five-year forage fish small pelagics average equals the median value.
- 50 - 75: The five-year forage fish small pelagics average is higher than the median value.
- 75 - 90: The five-year forage fish small pelagics average is much higher than the median value.
- 90 - 100: The five-year forage fish small pelagics average is very high compared to the median value.
Data:
Data for forage fish and small pelagics were obtained from regional NOAA Integrated Ecosystem Assessment Program teams that produce indicators and Ecosystem Status Report. For more information https://www.integratedecosystemassessment.noaa.gov/
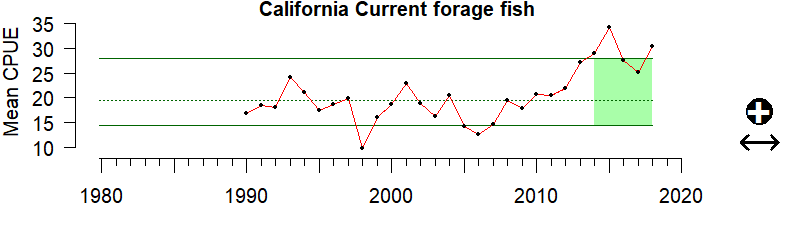
California Current
Description of time series:
During the last five years the forage fish biomass shows no significant trend but is above the 90th percentile.
Description of gauge:
The Gauge value of 93 indicates that over the last five years, the forage fish biomass is very high compared to the median value.
Description of forage fish:
Forage fish or otherwise known as small pelagics are fish and invertebrates (like squids) that inhabit - the pelagic zone - the open ocean. The number and distribution of pelagic fish vary regionally, depending on multiple physical and ecological factors i.e. the availability of light, nutrients, dissolved oxygen, temperature, salinity, predation, abundance of phytoplankton and zooplankton, etc. Small pelagics are known to exhibit “boom and bust” cycles of abundance in response to these conditions. Examples include anchovies, sardines, shad, menhaden and the fish that feed on them
Small pelagic species are often important to fisheries and serve as forage for commercially and recreationally important fish, as well as other ecosystem species (e.g. seabirds and marine mammals). They are a critical part of marine food webs and important to monitor because so many other organisms depend on them. We present the annual total biomass of small pelagics/forage fish in the Alaska, California Current, and Northeast regions, as well as selected taxa in the Gulf of Mexico region.
Overall Scores means the following:
- 0 - 10: The five-year forage fish small pelagics average is very low compared to the median value.
- 10 - 25: The five-year forage fish small pelagics average is much lower than the median value.
- 25 - 50: The five-year forage fish small pelagics average is lower than the median value.
- 50: The five-year forage fish small pelagics average equals the median value.
- 50 - 75: The five-year forage fish small pelagics average is higher than the median value.
- 75 - 90: The five-year forage fish small pelagics average is much higher than the median value.
- 90 - 100: The five-year forage fish small pelagics average is very high compared to the median value.
Data:
Data for forage fish and small pelagics were obtained from regional NOAA Integrated Ecosystem Assessment Program teams that produce indicators and Ecosystem Status Report. For more information https://www.integratedecosystemassessment.noaa.gov/
Gulf of Mexico
Menhaden biomass
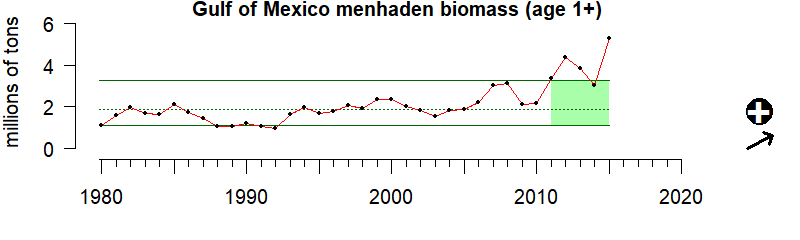
Description of time series:
During the last five years the forage fish biomass shows a significant upward trend and is above the 90th percentile.
Description of gauge:
The Gauge value of 94 indicates that over the last five years, the forage fish biomass is very high compared to the median value.
Description of forage fish:
Forage fish or otherwise known as small pelagics are fish and invertebrates (like squids) that inhabit - the pelagic zone - the open ocean. The number and distribution of pelagic fish vary regionally, depending on multiple physical and ecological factors i.e. the availability of light, nutrients, dissolved oxygen, temperature, salinity, predation, abundance of phytoplankton and zooplankton, etc. Small pelagics are known to exhibit “boom and bust” cycles of abundance in response to these conditions. Examples include anchovies, sardines, shad, menhaden and the fish that feed on them
Small pelagic species are often important to fisheries and serve as forage for commercially and recreationally important fish, as well as other ecosystem species (e.g. seabirds and marine mammals). They are a critical part of marine food webs and important to monitor because so many other organisms depend on them. We present the annual total biomass of small pelagics/forage fish in the Alaska, California Current, and Northeast regions, as well as selected taxa in the Gulf of Mexico region.
Overall Scores means the following:
- 0 - 10: The five-year forage fish small pelagics average is very low compared to the median value.
- 10 - 25: The five-year forage fish small pelagics average is much lower than the median value.
- 25 - 50: The five-year forage fish small pelagics average is lower than the median value.
- 50: The five-year forage fish small pelagics average equals the median value.
- 50 - 75: The five-year forage fish small pelagics average is higher than the median value.
- 75 - 90: The five-year forage fish small pelagics average is much higher than the median value.
- 90 - 100: The five-year forage fish small pelagics average is very high compared to the median value.
Data:
Data for forage fish and small pelagics were obtained from regional NOAA Integrated Ecosystem Assessment Program teams that produce indicators and Ecosystem Status Report. For more information https://www.integratedecosystemassessment.noaa.gov/
Northeast
Planktivore biomass
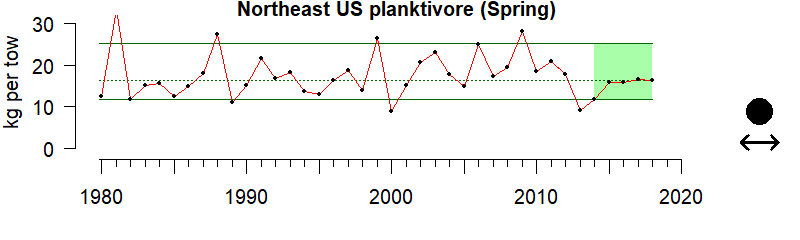
Description of time series:
During the last five years the forage fish biomass shows no significant trend.
Description of gauge:
The Gauge value of 38 indicates that over the last five years, the forage fish biomass is much lower than the median value.
Description of forage fish:
Forage fish or otherwise known as small pelagics are fish and invertebrates (like squids) that inhabit - the pelagic zone - the open ocean. The number and distribution of pelagic fish vary regionally, depending on multiple physical and ecological factors i.e. the availability of light, nutrients, dissolved oxygen, temperature, salinity, predation, abundance of phytoplankton and zooplankton, etc. Small pelagics are known to exhibit “boom and bust” cycles of abundance in response to these conditions. Examples include anchovies, sardines, shad, menhaden and the fish that feed on them
Small pelagic species are often important to fisheries and serve as forage for commercially and recreationally important fish, as well as other ecosystem species (e.g. seabirds and marine mammals). They are a critical part of marine food webs and important to monitor because so many other organisms depend on them. We present the annual total biomass of small pelagics/forage fish in the Alaska, California Current, and Northeast regions, as well as selected taxa in the Gulf of Mexico region.
Overall Scores means the following:
- 0 - 10: The five-year forage fish small pelagics average is very low compared to the median value.
- 10 - 25: The five-year forage fish small pelagics average is much lower than the median value.
- 25 - 50: The five-year forage fish small pelagics average is lower than the median value.
- 50: The five-year forage fish small pelagics average equals the median value.
- 50 - 75: The five-year forage fish small pelagics average is higher than the median value.
- 75 - 90: The five-year forage fish small pelagics average is much higher than the median value.
- 90 - 100: The five-year forage fish small pelagics average is very high compared to the median value.
Data:
Data for forage fish and small pelagics were obtained from regional NOAA Integrated Ecosystem Assessment Program teams that produce indicators and Ecosystem Status Report. For more information https://www.integratedecosystemassessment.noaa.gov/