
Description of Fishing Engagement:
Recreational and commercial fishing engagement is measured by the presence of fishing activity in coastal communities. The commercial engagement index is measured through permits, fish dealers, and vessel landings. The data for recreational engagement indicators varies by state. A high rank within these indicates more engagement in fisheries. For details on both data sources and indicator development, please see https://www.fisheries.noaa.gov/national/socioeconomics/social-indicators-fishing-communities-0.
NOAA Monitors recreational and commercial fishing engagement to better understand the social and economic impacts of fishing policies and regulations on our nation’s vital fishing communities. This and other social indicators help assess a coastal community’s resilience. NOAA works with state and local partners to monitor these indicators. We present data from the Northeast, Southeast, Gulf of Mexico, California Current, Alaska, and Pacific Island regions.
Data:
Recreational and Commercial fishing engagement data is from the National Marine Fisheries Service’s social indicator data portal: https://www.st.nmfs.noaa.gov/data-and-tools/social-indicators/ The percentage of all communities in each region classified as medium, medium high, or highly engaged is presented for both recreational and commercial fishing.
Alaska
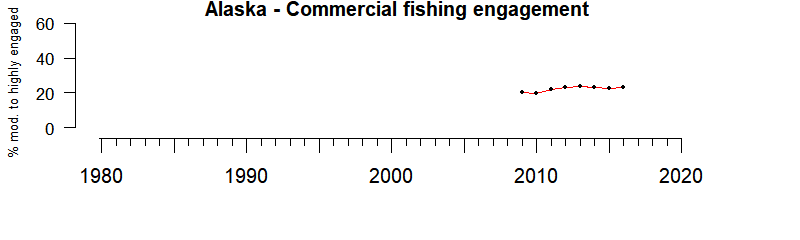
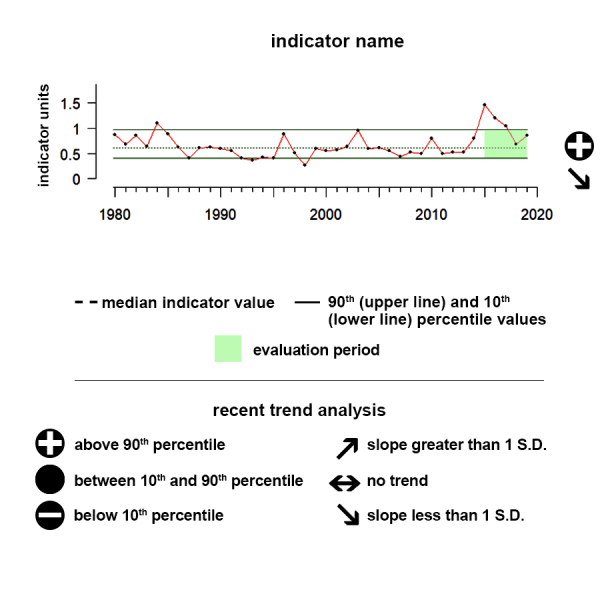
Description of time series:
There isn't enough data to do trend analysis.
Description of gauge:
The 2012 – 2016 average percentage of commercially engaged communities in Alaska is greater than 62% of all engagement levels between 2009 and 2016 in that state, indicating that recent engagement levels are similar to median historical levels.
Description of Fishing Engagement:
Recreational and commercial fishing engagement is measured by the presence of fishing activity in coastal communities. The commercial engagement index is measured through permits, fish dealers, and vessel landings. The data for recreational engagement indicators varies by state. A high rank within these indicates more engagement in fisheries. For details on both data sources and indicator development, please see https://www.fisheries.noaa.gov/national/socioeconomics/social-indicators-fishing-communities-0.
NOAA Monitors recreational and commercial fishing engagement to better understand the social and economic impacts of fishing policies and regulations on our nation’s vital fishing communities. This and other social indicators help assess a coastal community’s resilience. NOAA works with state and local partners to monitor these indicators. We present data from the Northeast, Southeast, Gulf of Mexico, California Current, Alaska, and Pacific Island regions.
Extreme Gauge values:
A value of zero on the gauge means that the average percentage of communities engaged in commercial or recreational fishing over the last 5 years of data was below any annual engagement level up until that point, while a value of 100 would indicate the average over that same period was above any engagement level up until that point.
Data:
Recreational and Commercial fishing engagement data is from the National Marine Fisheries Service’s social indicator data portal:https://www.st.nmfs.noaa.gov/data-and-tools/social-indicators/ The percentage of all communities in each region classified as medium, medium high, or highly engaged is presented for both recreational and commercial fishing.
Hawaii - Pacific Islands
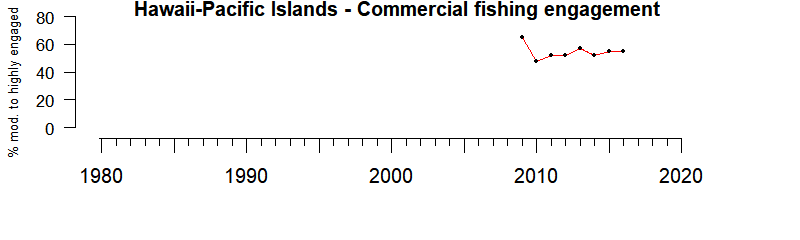
Description of time series:
There isn't enough data to do trend analysis.
Description of gauge:
The 2012 – 2016 average percentage of commercially engaged communities in Hawaii is greater than 50% of all engagement levels between 2009 and 2016 in that state, indicating that recent engagement levels are similar to median historical levels.
Description of Fishing Engagement:
Recreational and commercial fishing engagement is measured by the presence of fishing activity in coastal communities. The commercial engagement index is measured through permits, fish dealers, and vessel landings. The data for recreational engagement indicators varies by state. A high rank within these indicates more engagement in fisheries. For details on both data sources and indicator development, please see https://www.fisheries.noaa.gov/national/socioeconomics/social-indicators-fishing-communities-0.
NOAA Monitors recreational and commercial fishing engagement to better understand the social and economic impacts of fishing policies and regulations on our nation’s vital fishing communities. This and other social indicators help assess a coastal community’s resilience. NOAA works with state and local partners to monitor these indicators. We present data from the Northeast, Southeast, Gulf of Mexico, California Current, Alaska, and Pacific Island regions.
Extreme Gauge values:
A value of zero on the gauge means that the average percentage of communities engaged in commercial or recreational fishing over the last 5 years of data was below any annual engagement level up until that point, while a value of 100 would indicate the average over that same period was above any engagement level up until that point.
Data:
Recreational and Commercial fishing engagement data is from the National Marine Fisheries Service’s social indicator data portal:https://www.st.nmfs.noaa.gov/data-and-tools/social-indicators/ The percentage of all communities in each region classified as medium, medium high, or highly engaged is presented for both recreational and commercial fishing.
California Current
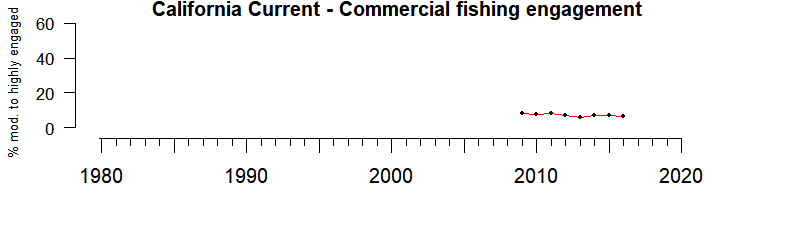
Description of time series:
There is not enough data to do trend analysis.
Description of gauge:
The 2012 – 2016 average percentage of commercially engaged communities in the California Current ecosystem is greater than 25% of all engagement levels between 2009 and 2016, indicating that recent engagement levels are somewhat lower than historical levels.
Description of Fishing Engagement:
Recreational and commercial fishing engagement is measured by the presence of fishing activity in coastal communities. The commercial engagement index is measured through permits, fish dealers, and vessel landings. The data for recreational engagement indicators varies by state. A high rank within these indicates more engagement in fisheries. For details on both data sources and indicator development, please see https://www.fisheries.noaa.gov/national/socioeconomics/social-indicators-fishing-communities-0.
NOAA Monitors recreational and commercial fishing engagement to better understand the social and economic impacts of fishing policies and regulations on our nation’s vital fishing communities. This and other social indicators help assess a coastal community’s resilience. NOAA works with state and local partners to monitor these indicators. We present data from the Northeast, Southeast, Gulf of Mexico, California Current, Alaska, and Pacific Island regions.
Extreme Gauge values:
A value of zero on the gauge means that the average percentage of communities engaged in commercial or recreational fishing over the last 5 years of data was below any annual engagement level up until that point, while a value of 100 would indicate the average over that same period was above any engagement level up until that point.
Data:
Recreational and Commercial fishing engagement data is from the National Marine Fisheries Service’s social indicator data portal:https://www.st.nmfs.noaa.gov/data-and-tools/social-indicators/ The percentage of all communities in each region classified as medium, medium high, or highly engaged is presented for both recreational and commercial fishing.
Gulf of Mexico
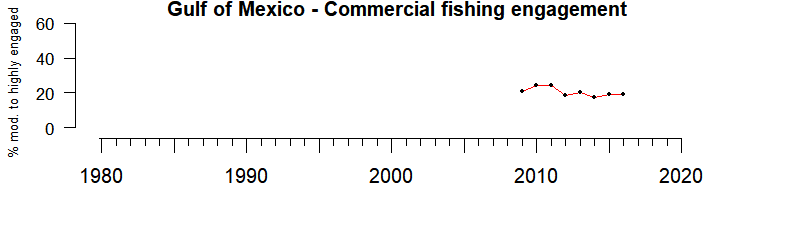
Description of time series:
There is not enough data to do trend analysis.
Description of gauge:
The 2012 – 2016 average percentage of commercially engaged communities along the Gulf of Mexico is greater than 25% of all engagement levels between 2009 and 2016 in that region, indicating that recent engagement levels are somewhat lower than historical levels.
Description of Fishing Engagement:
Recreational and commercial fishing engagement is measured by the presence of fishing activity in coastal communities. The commercial engagement index is measured through permits, fish dealers, and vessel landings. The data for recreational engagement indicators varies by state. A high rank within these indicates more engagement in fisheries. For details on both data sources and indicator development, please see https://www.fisheries.noaa.gov/national/socioeconomics/social-indicators-fishing-communities-0.
NOAA Monitors recreational and commercial fishing engagement to better understand the social and economic impacts of fishing policies and regulations on our nation’s vital fishing communities. This and other social indicators help assess a coastal community’s resilience. NOAA works with state and local partners to monitor these indicators. We present data from the Northeast, Southeast, Gulf of Mexico, California Current, Alaska, and Pacific Island regions.
Extreme Gauge values:
A value of zero on the gauge means that the average percentage of communities engaged in commercial or recreational fishing over the last 5 years of data was below any annual engagement level up until that point, while a value of 100 would indicate the average over that same period was above any engagement level up until that point.
Data:
Recreational and Commercial fishing engagement data is from the National Marine Fisheries Service’s social indicator data portal:https://www.st.nmfs.noaa.gov/data-and-tools/social-indicators/ The percentage of all communities in each region classified as medium, medium high, or highly engaged is presented for both recreational and commercial fishing.
Southeast US
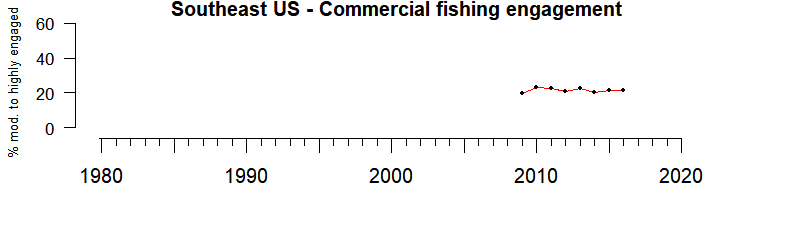
Description of time series:
There isn't enough data to do trend analysis.
Description of gauge:
The 2012 – 2016 average percentage of commercially engaged communities in the Southeast is greater than 50% of all engagement levels between 2009 and 2016 in that region, indicating that recent engagement levels are at median historical levels.
Description of Fishing Engagement:
Recreational and commercial fishing engagement is measured by the presence of fishing activity in coastal communities. The commercial engagement index is measured through permits, fish dealers, and vessel landings. The data for recreational engagement indicators varies by state. A high rank within these indicates more engagement in fisheries. For details on both data sources and indicator development, please see https://www.fisheries.noaa.gov/national/socioeconomics/social-indicators-fishing-communities-0.
NOAA Monitors recreational and commercial fishing engagement to better understand the social and economic impacts of fishing policies and regulations on our nation’s vital fishing communities. This and other social indicators help assess a coastal community’s resilience. NOAA works with state and local partners to monitor these indicators. We present data from the Northeast, Southeast, Gulf of Mexico, California Current, Alaska, and Pacific Island regions.
Extreme Gauge values:
A value of zero on the gauge means that the average percentage of communities engaged in commercial or recreational fishing over the last 5 years of data was below any annual engagement level up until that point, while a value of 100 would indicate the average over that same period was above any engagement level up until that point.
Data:
Recreational and Commercial fishing engagement data is from the National Marine Fisheries Service’s social indicator data portal:https://www.st.nmfs.noaa.gov/data-and-tools/social-indicators/ The percentage of all communities in each region classified as medium, medium high, or highly engaged is presented for both recreational and commercial fishing.
Northeast US
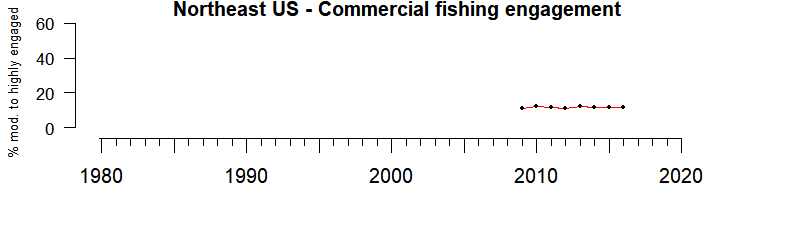
Description of time series:
There isn't enough data to do trend analysis.
Description of gauge:
The 2012 – 2016 average percentage of commercially engaged communities in the Northeast is greater than 62% of all engagement levels between 2009 and 2016 in that region, indicating that recent engagement levels are similar to median historical levels.
Description of Fishing Engagement:
Recreational and commercial fishing engagement is measured by the presence of fishing activity in coastal communities. The commercial engagement index is measured through permits, fish dealers, and vessel landings. The data for recreational engagement indicators varies by state. A high rank within these indicates more engagement in fisheries. For details on both data sources and indicator development, please see https://www.fisheries.noaa.gov/national/socioeconomics/social-indicators-fishing-communities-0.
NOAA Monitors recreational and commercial fishing engagement to better understand the social and economic impacts of fishing policies and regulations on our nation’s vital fishing communities. This and other social indicators help assess a coastal community’s resilience. NOAA works with state and local partners to monitor these indicators. We present data from the Northeast, Southeast, Gulf of Mexico, California Current, Alaska, and Pacific Island regions.
Extreme Gauge values:
A value of zero on the gauge means that the average percentage of communities engaged in commercial or recreational fishing over the last 5 years of data was below any annual engagement level up until that point, while a value of 100 would indicate the average over that same period was above any engagement level up until that point.
Data:
Recreational and Commercial fishing engagement data is from the National Marine Fisheries Service’s social indicator data portal:https://www.st.nmfs.noaa.gov/data-and-tools/social-indicators/ The percentage of all communities in each region classified as medium, medium high, or highly engaged is presented for both recreational and commercial fishing.
Alaska
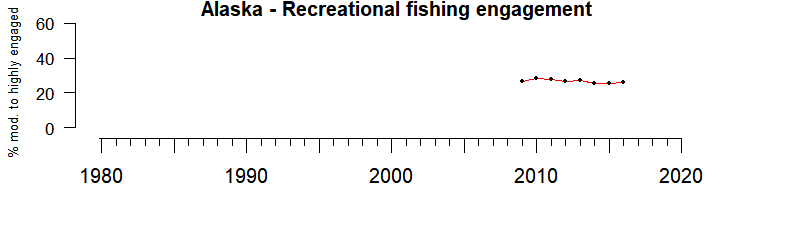
Description of time series:
There isn't enough data to do trend analysis. The Alaska recreational engagement index is measured using the number of charter and sportfishing guide businesses, and sportfishing and guide licenses.
Description of gauge:
The 2012 – 2016 average percentage of recreationally engaged communities in Alaska is greater than 38% of engagement levels between 2009 and 2016 in that state, indicating that recent engagement levels are similar to the median historical level.
Description of Fishing Engagement:
Recreational and commercial fishing engagement is measured by the presence of fishing activity in coastal communities. The commercial engagement index is measured through permits, fish dealers, and vessel landings. The data for recreational engagement indicators varies by state. A high rank within these indicates more engagement in fisheries. For details on both data sources and indicator development, please see https://www.fisheries.noaa.gov/national/socioeconomics/social-indicators-fishing-communities-0.
NOAA Monitors recreational and commercial fishing engagement to better understand the social and economic impacts of fishing policies and regulations on our nation’s vital fishing communities. This and other social indicators help assess a coastal community’s resilience. NOAA works with state and local partners to monitor these indicators. We present data from the Northeast, Southeast, Gulf of Mexico, California Current, Alaska, and Pacific Island regions.
Extreme Gauge values:
A value of zero on the gauge means that the average percentage of communities engaged in commercial or recreational fishing over the last 5 years of data was below any annual engagement level up until that point, while a value of 100 would indicate the average over that same period was above any engagement level up until that point.
Data:
Recreational and Commercial fishing engagement data is from the National Marine Fisheries Service’s social indicator data portal:https://www.st.nmfs.noaa.gov/data-and-tools/social-indicators/ The percentage of all communities in each region classified as medium, medium high, or highly engaged is presented for both recreational and commercial fishing.
Hawaii - Pacific Islands
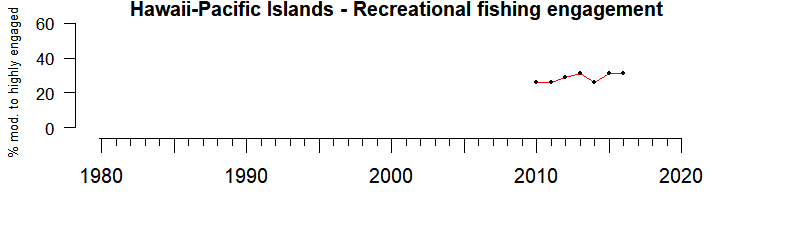
Description of time series:
There isn't enough data to do trend analysis. The Hawaii recreational engagement index is measured using the number of trips for charter, private recreational, shore and all modes combined.
Description of gauge:
The 2012 – 2016 average percentage of recreationally engaged communities in Hawaii is greater than 50% of engagement levels between 2010 and 2016 in that state, indicating that recent engagement levels are at median historical levels.
Description of Fishing Engagement:
Recreational and commercial fishing engagement is measured by the presence of fishing activity in coastal communities. The commercial engagement index is measured through permits, fish dealers, and vessel landings. The data for recreational engagement indicators varies by state. A high rank within these indicates more engagement in fisheries. For details on both data sources and indicator development, please see https://www.fisheries.noaa.gov/national/socioeconomics/social-indicators-fishing-communities-0.
NOAA Monitors recreational and commercial fishing engagement to better understand the social and economic impacts of fishing policies and regulations on our nation’s vital fishing communities. This and other social indicators help assess a coastal community’s resilience. NOAA works with state and local partners to monitor these indicators. We present data from the Northeast, Southeast, Gulf of Mexico, California Current, Alaska, and Pacific Island regions.
Extreme Gauge values:
A value of zero on the gauge means that the average percentage of communities engaged in commercial or recreational fishing over the last 5 years of data was below any annual engagement level up until that point, while a value of 100 would indicate the average over that same period was above any engagement level up until that point.
Data:
Recreational and Commercial fishing engagement data is from the National Marine Fisheries Service’s social indicator data portal:https://www.st.nmfs.noaa.gov/data-and-tools/social-indicators/ The percentage of all communities in each region classified as medium, medium high, or highly engaged is presented for both recreational and commercial fishing.
Gulf of Mexico
Description of time series:
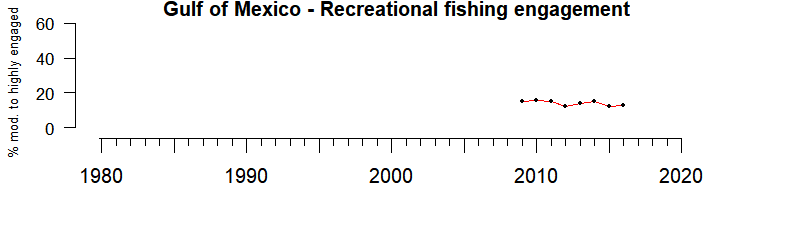
There isn't enough data to do trend analysis. The Gulf of Mexico recreational engagement index is measured using shore, private vessel and for-hire vessel fishing activity estimates for western Florida to Mississippi. The index for Louisiana and Texas is measured using estimates for boat ramps, fishing piers, recreational vessels by homeport and recreational vessels by owner address.
Description of gauge:
The 2012 – 2016 average percentage of recreationally engaged communities along the Gulf of Mexico is greater than 38% of engagement levels between 2009 and 2016 in that region, indicating that recent engagement levels are similar to median historical levels.
Description of Fishing Engagement:
Recreational and commercial fishing engagement is measured by the presence of fishing activity in coastal communities. The commercial engagement index is measured through permits, fish dealers, and vessel landings. The data for recreational engagement indicators varies by state. A high rank within these indicates more engagement in fisheries. For details on both data sources and indicator development, please see https://www.fisheries.noaa.gov/national/socioeconomics/social-indicators-fishing-communities-0.
NOAA Monitors recreational and commercial fishing engagement to better understand the social and economic impacts of fishing policies and regulations on our nation’s vital fishing communities. This and other social indicators help assess a coastal community’s resilience. NOAA works with state and local partners to monitor these indicators. We present data from the Northeast, Southeast, Gulf of Mexico, California Current, Alaska, and Pacific Island regions.
Extreme Gauge values:
A value of zero on the gauge means that the average percentage of communities engaged in commercial or recreational fishing over the last 5 years of data was below any annual engagement level up until that point, while a value of 100 would indicate the average over that same period was above any engagement level up until that point.
Data:
Recreational and Commercial fishing engagement data is from the National Marine Fisheries Service’s social indicator data portal:https://www.st.nmfs.noaa.gov/data-and-tools/social-indicators/ The percentage of all communities in each region classified as medium, medium high, or highly engaged is presented for both recreational and commercial fishing.
Southeast US
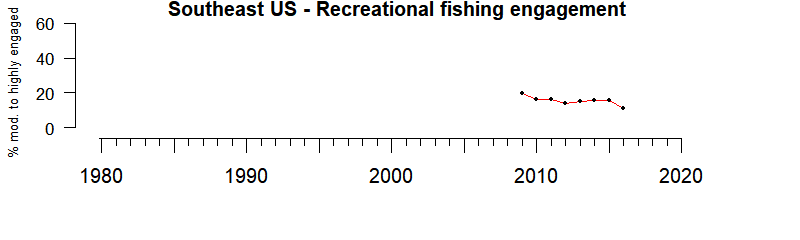
Description of time series:
There isn't enough data to do trend analysis. The Southeast recreational engagement index is measured using shore, private vessel and for-hire vessel fishing activity estimates.
Description of gauge:
The 2012 – 2016 average percentage of recreationally engaged communities in the Southeast is greater than 25% of engagement levels between 2009 and 2016 in that region, indicating that recent engagement levels are somewhat lower than historical levels.
Description of Fishing Engagement:
Recreational and commercial fishing engagement is measured by the presence of fishing activity in coastal communities. The commercial engagement index is measured through permits, fish dealers, and vessel landings. The data for recreational engagement indicators varies by state. A high rank within these indicates more engagement in fisheries. For details on both data sources and indicator development, please see https://www.fisheries.noaa.gov/national/socioeconomics/social-indicators-fishing-communities-0.
NOAA Monitors recreational and commercial fishing engagement to better understand the social and economic impacts of fishing policies and regulations on our nation’s vital fishing communities. This and other social indicators help assess a coastal community’s resilience. NOAA works with state and local partners to monitor these indicators. We present data from the Northeast, Southeast, Gulf of Mexico, California Current, Alaska, and Pacific Island regions.
Extreme Gauge values:
A value of zero on the gauge means that the average percentage of communities engaged in commercial or recreational fishing over the last 5 years of data was below any annual engagement level up until that point, while a value of 100 would indicate the average over that same period was above any engagement level up until that point.
Data:
Recreational and Commercial fishing engagement data is from the National Marine Fisheries Service’s social indicator data portal:https://www.st.nmfs.noaa.gov/data-and-tools/social-indicators/ The percentage of all communities in each region classified as medium, medium high, or highly engaged is presented for both recreational and commercial fishing.
Northeast US
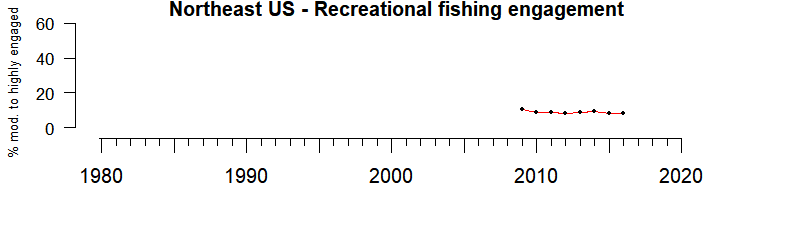
Description of time series:
There isn't enough data to do trend analysis. The Northeast recreational engagement indicator is measured using shore, private vessel and for-hire vessel fishing activity estimates.
Description of gauge:
The 2012 – 2016 average percentage of recreationally engaged communities in the Northeast is greater than 38% of engagement levels between 2009 and 2016 in that region, indicating that recent engagement levels are similar to median historical levels.
Description of Fishing Engagement:
Recreational and commercial fishing engagement is measured by the presence of fishing activity in coastal communities. The commercial engagement index is measured through permits, fish dealers, and vessel landings. The data for recreational engagement indicators varies by state. A high rank within these indicates more engagement in fisheries. For details on both data sources and indicator development, please see https://www.fisheries.noaa.gov/national/socioeconomics/social-indicators-fishing-communities-0.
NOAA Monitors recreational and commercial fishing engagement to better understand the social and economic impacts of fishing policies and regulations on our nation’s vital fishing communities. This and other social indicators help assess a coastal community’s resilience. NOAA works with state and local partners to monitor these indicators. We present data from the Northeast, Southeast, Gulf of Mexico, California Current, Alaska, and Pacific Island regions.
Extreme Gauge values:
A value of zero on the gauge means that the average percentage of communities engaged in commercial or recreational fishing over the last 5 years of data was below any annual engagement level up until that point, while a value of 100 would indicate the average over that same period was above any engagement level up until that point.
Data:
Recreational and Commercial fishing engagement data is from the National Marine Fisheries Service’s social indicator data portal:https://www.st.nmfs.noaa.gov/data-and-tools/social-indicators/ The percentage of all communities in each region classified as medium, medium high, or highly engaged is presented for both recreational and commercial fishing.
Resources
National Marine Fisheries Service Social Indicators
Social indicators are numerical measures that describe the well-being of individuals or communities. Indicators are comprised of one variable or several components combined into an index. They are used to describe and evaluate community well-being in terms of social, economic, and psychological welfare.
Fishing Community Profiles
Engagement in fisheries and information on the social and economic characteristics of these communities.
NOAA Economic National Ocean Watch data base
The Economics: National Ocean Watch (ENOW) data set features time-series data focused on the six economic sectors that are dependent on the oceans and Great Lakes. ENOW is available for counties, states, regions, and the nation in a wide variety of formats.