Description of Recreational Fishing (Effort and Harvest):
U.S. saltwater recreational fishing is an important source of seafood, jobs, and recreation for millions of anglers and for-hire recreational businesses. Recreational fishing effort is measured as “Angler Trips”, which is the number of recreational fishing trips people go on. Recreational fishing harvest is the number of fish caught and brought to shore on recreational fishing trips.
Recreational effort and harvest help us understand how recreational opportunities and seafood derived from our marine environment is changing over time. Fisheries managers use this data to set annual catch limits and fishing regulations, including season lengths, size, and daily catch limits. We present the total number of fish caught and angler trips annually for all marine fish in all regions.
Data:
Recreational harvest and effort data pulled from National Summary Query at https://www.st.nmfs.noaa.gov/recreational-fisheries/data-and-documentation/queries/index Units of data are in Effort in Angler Days and Harvest in numbers of fish.
Alaska
Description of time series:
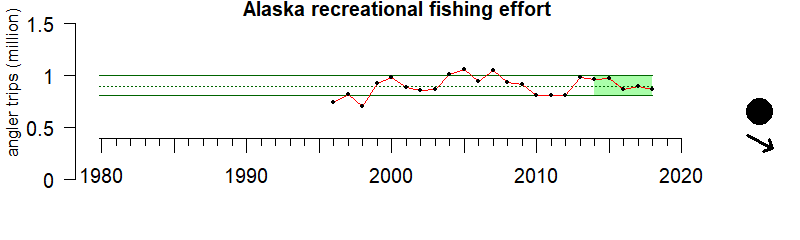
Between 2013 and 2018, recreational fishing effort from Alaska is around historic levels. There is a significant downward trend apparent.
Description of gauge:
Between 2013 and 2018, Alaska’s average recreational fishing effort was greater than 52% of all recreational fishing effort from 1996 to 2018.
Description of Recreational Fishing (Effort and Harvest):
U.S. saltwater recreational fishing is an important source of seafood, jobs, and recreation for millions of anglers and for-hire recreational businesses. Recreational fishing effort is measured as “Angler Trips”, which is the number of recreational fishing trips people go on. Recreational fishing harvest is the number of fish caught and brought to shore on recreational fishing trips.
Recreational effort and harvest help us understand how recreational opportunities and seafood derived from our marine environment is changing over time. Fisheries managers use this data to set annual catch limits and fishing regulations, including season lengths, size, and daily catch limits. We present the total number of fish caught and angler trips annually for all marine fish in all regions.
Extreme Gauge values:
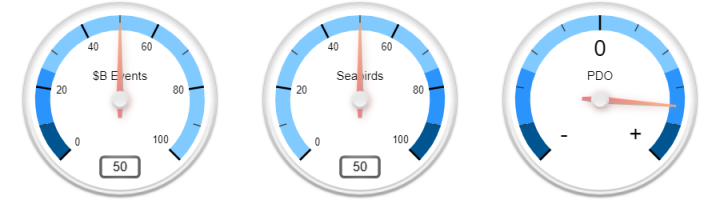
A value of zero on the gauge means that the average effort or harvest over the last 5 years of data was below any annual value up until that point, while a value of 100 would indicate the average value over that same period was above any annual value up until that point.
Data:
Recreational harvest and effort data pulled from National Summary Query at https://www.st.nmfs.noaa.gov/recreational-fisheries/data-and-documentation/queries/index Units of data are in Effort in Angler Days and Harvest in numbers of fish.
Hawaii-Pacific Islands
Description of time series:
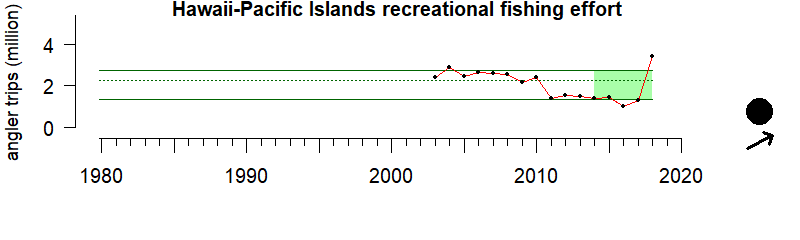
Between 2013 and 2018, recreational fishing effort in the Hawaiʻi-Pacific Islands is around historic levels and shows a significant upward trend apparent.
Description of gauge:
Between 2013 and 2018, Hawaiʻi’s average recreational fishing effort was greater than 44% of all recreational fishing effort from 2003 to 2018.
Description of Recreational Fishing (Effort and Harvest):
U.S. saltwater recreational fishing is an important source of seafood, jobs, and recreation for millions of anglers and for-hire recreational businesses. Recreational fishing effort is measured as “Angler Trips”, which is the number of recreational fishing trips people go on. Recreational fishing harvest is the number of fish caught and brought to shore on recreational fishing trips.
Recreational effort and harvest help us understand how recreational opportunities and seafood derived from our marine environment is changing over time. Fisheries managers use this data to set annual catch limits and fishing regulations, including season lengths, size, and daily catch limits. We present the total number of fish caught and angler trips annually for all marine fish in all regions.
Extreme Gauge values:
A value of zero on the gauge means that the average effort or harvest over the last 5 years of data was below any annual value up until that point, while a value of 100 would indicate the average value over that same period was above any annual value up until that point.
Data:
Recreational harvest and effort data pulled from National Summary Query at https://www.st.nmfs.noaa.gov/recreational-fisheries/data-and-documentation/queries/index Units of data are in Effort in Angler Days and Harvest in numbers of fish.
California Current
Description of time series:
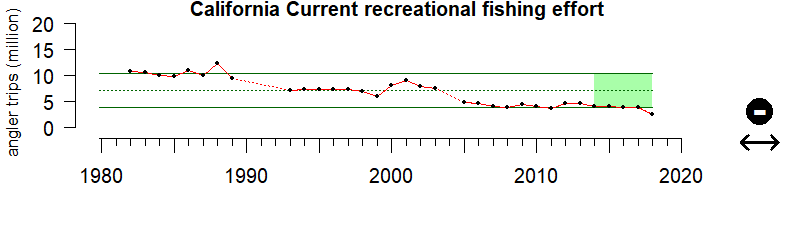
Between 2013 and 2018, recreational fishing effort in California Current is below historic levels and shows no trend.
Description of gauge:
Between 2013 and 2018, California Current’s average recreational fishing effort was greater than 6% of all recreational fishing effort from 1982 to 2018.
Description of Recreational Fishing (Effort and Harvest):
U.S. saltwater recreational fishing is an important source of seafood, jobs, and recreation for millions of anglers and for-hire recreational businesses. Recreational fishing effort is measured as “Angler Trips”, which is the number of recreational fishing trips people go on. Recreational fishing harvest is the number of fish caught and brought to shore on recreational fishing trips.
Recreational effort and harvest help us understand how recreational opportunities and seafood derived from our marine environment is changing over time. Fisheries managers use this data to set annual catch limits and fishing regulations, including season lengths, size, and daily catch limits. We present the total number of fish caught and angler trips annually for all marine fish in all regions.
Extreme Gauge values:
A value of zero on the gauge means that the average effort or harvest over the last 5 years of data was below any annual value up until that point, while a value of 100 would indicate the average value over that same period was above any annual value up until that point.
Data:
Recreational harvest and effort data pulled from National Summary Query at https://www.st.nmfs.noaa.gov/recreational-fisheries/data-and-documentation/queries/index Units of data are in Effort in Angler Days and Harvest in numbers of fish.
Gulf of Mexico
Description of time series:
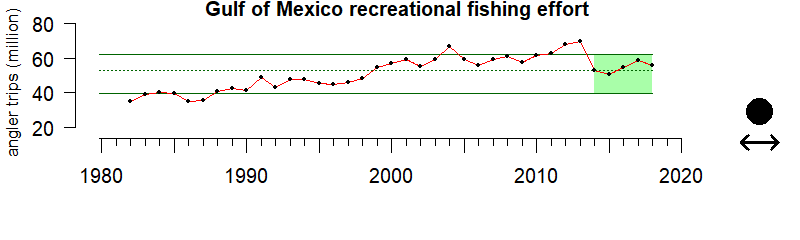
Between 2013 and 2018, recreational fishing effort in the Gulf of Mexico is around historic levels. There is no trend apparent.
Description of gauge:
Between 2013 and 2018, the Gulf of Mexico’s average recreational fishing effort was greater than 57% of all recreational fishing effort from 1982 to 2018.
Description of Recreational Fishing (Effort and Harvest):
U.S. saltwater recreational fishing is an important source of seafood, jobs, and recreation for millions of anglers and for-hire recreational businesses. Recreational fishing effort is measured as “Angler Trips”, which is the number of recreational fishing trips people go on. Recreational fishing harvest is the number of fish caught and brought to shore on recreational fishing trips.
Recreational effort and harvest help us understand how recreational opportunities and seafood derived from our marine environment is changing over time. Fisheries managers use this data to set annual catch limits and fishing regulations, including season lengths, size, and daily catch limits. We present the total number of fish caught and angler trips annually for all marine fish in all regions.
Extreme Gauge values:
A value of zero on the gauge means that the average effort or harvest over the last 5 years of data was below any annual value up until that point, while a value of 100 would indicate the average value over that same period was above any annual value up until that point.
Data:
Recreational harvest and effort data pulled from National Summary Query at https://www.st.nmfs.noaa.gov/recreational-fisheries/data-and-documentation/queries/index Units of data are in Effort in Angler Days and Harvest in numbers of fish.
Southeast US
Description of time series:
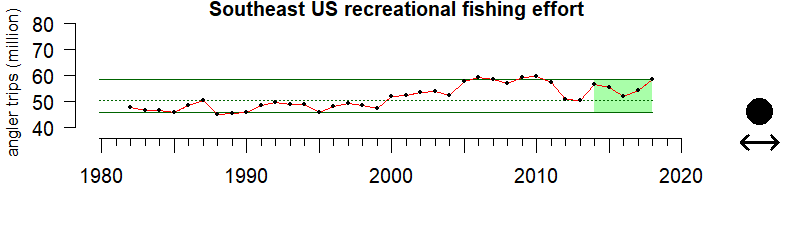
Between 2013 and 2018, recreational fishing effort in Southeast is around historic levels and shows no trend.
Description of gauge:
Between 2013 and 2018, the Southeast’s average recreational fishing effort was greater than 73% of all recreational fishing effort from 1982 to 2018.
Description of Recreational Fishing (Effort and Harvest):
U.S. saltwater recreational fishing is an important source of seafood, jobs, and recreation for millions of anglers and for-hire recreational businesses. Recreational fishing effort is measured as “Angler Trips”, which is the number of recreational fishing trips people go on. Recreational fishing harvest is the number of fish caught and brought to shore on recreational fishing trips.
Recreational effort and harvest help us understand how recreational opportunities and seafood derived from our marine environment is changing over time. Fisheries managers use this data to set annual catch limits and fishing regulations, including season lengths, size, and daily catch limits. We present the total number of fish caught and angler trips annually for all marine fish in all regions.
Extreme Gauge values:
A value of zero on the gauge means that the average effort or harvest over the last 5 years of data was below any annual value up until that point, while a value of 100 would indicate the average value over that same period was above any annual value up until that point.
Data:
Recreational harvest and effort data pulled from National Summary Query at https://www.st.nmfs.noaa.gov/recreational-fisheries/data-and-documentation/queries/index Units of data are in Effort in Angler Days and Harvest in numbers of fish.
Northeast US
Description of time series:
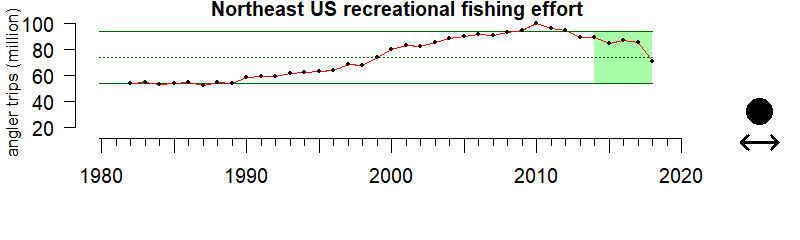
Between 2013 and 2018, recreational fishing effort in the Northeast is around historic levels and shows no trend.
Description of gauge:
Between 2013 and 2018, the Northeast’s average recreational fishing effort was greater than 59% of all recreational fishing effort from 1982 to 2018.
Description of Recreational Fishing (Effort and Harvest):
U.S. saltwater recreational fishing is an important source of seafood, jobs, and recreation for millions of anglers and for-hire recreational businesses. Recreational fishing effort is measured as “Angler Trips”, which is the number of recreational fishing trips people go on. Recreational fishing harvest is the number of fish caught and brought to shore on recreational fishing trips.
Recreational effort and harvest help us understand how recreational opportunities and seafood derived from our marine environment is changing over time. Fisheries managers use this data to set annual catch limits and fishing regulations, including season lengths, size, and daily catch limits. We present the total number of fish caught and angler trips annually for all marine fish in all regions.
Extreme Gauge values:
A value of zero on the gauge means that the average effort or harvest over the last 5 years of data was below any annual value up until that point, while a value of 100 would indicate the average value over that same period was above any annual value up until that point.
Data:
Recreational harvest and effort data pulled from National Summary Query at https://www.st.nmfs.noaa.gov/recreational-fisheries/data-and-documentation/queries/index Units of data are in Effort in Angler Days and Harvest in numbers of fish.
Alaska
Description of time series:
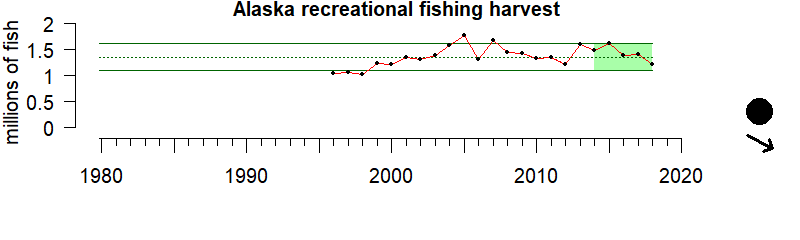
Between 2013 and 2018, recreational harvest from Alaska are around historic levels. There is a significant upward trend apparent.
Description of gauge:
Between 2013 and 2018, Alaska’s average recreational harvest were greater than 65% of all harvest from 1996 to 2018.
Description of Recreational Fishing (Effort and Harvest):
U.S. saltwater recreational fishing is an important source of seafood, jobs, and recreation for millions of anglers and for-hire recreational businesses. Recreational fishing effort is measured as “Angler Trips”, which is the number of recreational fishing trips people go on. Recreational fishing harvest is the number of fish caught and brought to shore on recreational fishing trips.
Recreational effort and harvest help us understand how recreational opportunities and seafood derived from our marine environment is changing over time. Fisheries managers use this data to set annual catch limits and fishing regulations, including season lengths, size, and daily catch limits. We present the total number of fish caught and angler trips annually for all marine fish in all regions.
Extreme Gauge values:
A value of zero on the gauge means that the average effort or harvest over the last 5 years of data was below any annual value up until that point, while a value of 100 would indicate the average value over that same period was above any annual value up until that point.
Data:
Recreational harvest and effort data pulled from National Summary Query at https://www.st.nmfs.noaa.gov/recreational-fisheries/data-and-documentation/queries/index Units of data are in Effort in Angler Days and Harvest in numbers of fish.
Hawaii-Pacific Islands
Description of time series:
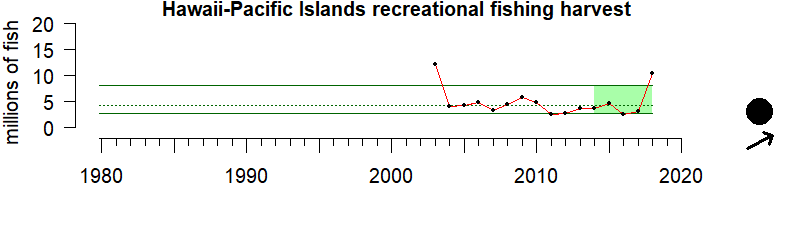
Between 2013 and 2018, recreational harvest from Hawaii are around historic levels. There is a significant upward trend apparent.
Description of gauge:
Between 2013 and 2018, Hawaii’s average recreational harvest was greater than 75% of all harvest from 2003-2018.
Description of Recreational Fishing (Effort and Harvest):
U.S. saltwater recreational fishing is an important source of seafood, jobs, and recreation for millions of anglers and for-hire recreational businesses. Recreational fishing effort is measured as “Angler Trips”, which is the number of recreational fishing trips people go on. Recreational fishing harvest is the number of fish caught and brought to shore on recreational fishing trips.
Recreational effort and harvest help us understand how recreational opportunities and seafood derived from our marine environment is changing over time. Fisheries managers use this data to set annual catch limits and fishing regulations, including season lengths, size, and daily catch limits. We present the total number of fish caught and angler trips annually for all marine fish in all regions.
Extreme Gauge values:
A value of zero on the gauge means that the average effort or harvest over the last 5 years of data was below any annual value up until that point, while a value of 100 would indicate the average value over that same period was above any annual value up until that point.
Data:
Recreational harvest and effort data pulled from National Summary Query at https://www.st.nmfs.noaa.gov/recreational-fisheries/data-and-documentation/queries/index Units of data are in Effort in Angler Days and Harvest in numbers of fish.
California Current
Description of time series:
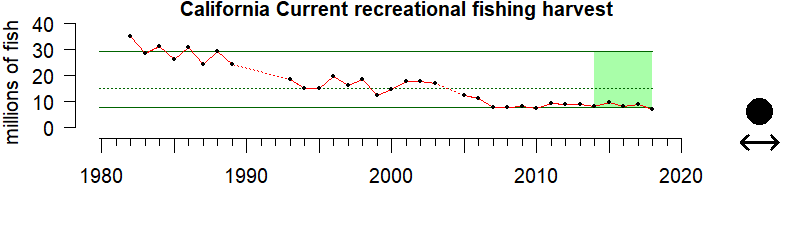
Between 2013 and 2018, recreational harvest from California Current are around historic levels. There is no significant trend apparent.
Description of gauge:
Between 2013 and 2018, California Current’s average recreational harvest were greater than 21% of all landings from 1982 to 2018.
Description of Recreational Fishing (Effort and Harvest):
U.S. saltwater recreational fishing is an important source of seafood, jobs, and recreation for millions of anglers and for-hire recreational businesses. Recreational fishing effort is measured as “Angler Trips”, which is the number of recreational fishing trips people go on. Recreational fishing harvest is the number of fish caught and brought to shore on recreational fishing trips.
Recreational effort and harvest help us understand how recreational opportunities and seafood derived from our marine environment is changing over time. Fisheries managers use this data to set annual catch limits and fishing regulations, including season lengths, size, and daily catch limits. We present the total number of fish caught and angler trips annually for all marine fish in all regions.
Extreme Gauge values:
A value of zero on the gauge means that the average effort or harvest over the last 5 years of data was below any annual value up until that point, while a value of 100 would indicate the average value over that same period was above any annual value up until that point.
Data:
Recreational harvest and effort data pulled from National Summary Query at https://www.st.nmfs.noaa.gov/recreational-fisheries/data-and-documentation/queries/index Units of data are in Effort in Angler Days and Harvest in numbers of fish.
Gulf of Mexico
Description of time series:
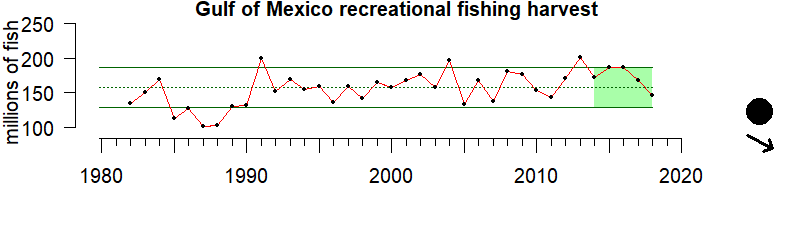
Between 2013 and 2018, recreational harvest from Gulf of Mexico are around historic levels. There is a significant upward trend apparent.
Description of gauge:
Between 2013 and 2018, Gulf of Mexico’s average recreational landings were greater than 76% of all landings from 1982 to 2018.
Description of Recreational Fishing (Effort and Harvest):
U.S. saltwater recreational fishing is an important source of seafood, jobs, and recreation for millions of anglers and for-hire recreational businesses. Recreational fishing effort is measured as “Angler Trips”, which is the number of recreational fishing trips people go on. Recreational fishing harvest is the number of fish caught and brought to shore on recreational fishing trips.
Recreational effort and harvest help us understand how recreational opportunities and seafood derived from our marine environment is changing over time. Fisheries managers use this data to set annual catch limits and fishing regulations, including season lengths, size, and daily catch limits. We present the total number of fish caught and angler trips annually for all marine fish in all regions.
Extreme Gauge values:
A value of zero on the gauge means that the average effort or harvest over the last 5 years of data was below any annual value up until that point, while a value of 100 would indicate the average value over that same period was above any annual value up until that point.
Data:
Recreational harvest and effort data pulled from National Summary Query at https://www.st.nmfs.noaa.gov/recreational-fisheries/data-and-documentation/queries/index Units of data are in Effort in Angler Days and Harvest in numbers of fish.
Southeast US
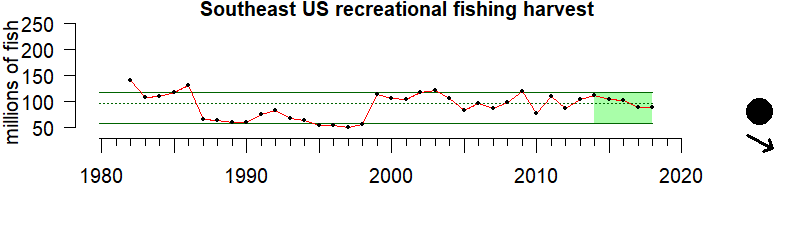
Description of time series:
Between 2013 and 2018, recreational harvest from Southeast are around historic levels. There is a significant downward trend apparent.
Description of gauge:
Between 2013 and 2018, Southeast’s average recreational harvest were greater than 54% of all harvest from 1982 to 2018.
Description of Recreational Fishing (Effort and Harvest):
U.S. saltwater recreational fishing is an important source of seafood, jobs, and recreation for millions of anglers and for-hire recreational businesses. Recreational fishing effort is measured as “Angler Trips”, which is the number of recreational fishing trips people go on. Recreational fishing harvest is the number of fish caught and brought to shore on recreational fishing trips.
Recreational effort and harvest help us understand how recreational opportunities and seafood derived from our marine environment is changing over time. Fisheries managers use this data to set annual catch limits and fishing regulations, including season lengths, size, and daily catch limits. We present the total number of fish caught and angler trips annually for all marine fish in all regions.
Extreme Gauge values:
A value of zero on the gauge means that the average effort or harvest over the last 5 years of data was below any annual value up until that point, while a value of 100 would indicate the average value over that same period was above any annual value up until that point.
Data:
Recreational harvest and effort data pulled from National Summary Query at https://www.st.nmfs.noaa.gov/recreational-fisheries/data-and-documentation/queries/index Units of data are in Effort in Angler Days and Harvest in numbers of fish.
Northeast US
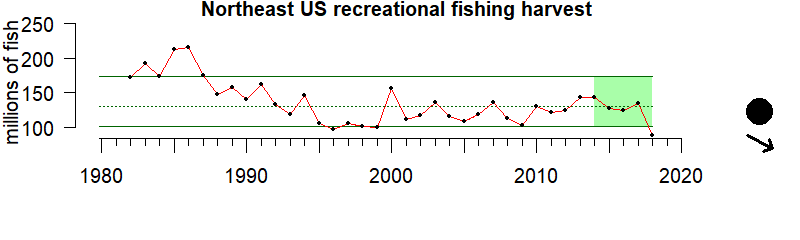
Description of time series:
Between 2013 and 2018, recreational harvest from Northeast are around historic levels. There is a significant downward trend apparent.
Description of gauge:
Between 2013 and 2018, Northeast’s average recreational harvest were greater than 41% of all harvest from 1982 to 2018.
Description of Recreational Fishing (Effort and Harvest):
U.S. saltwater recreational fishing is an important source of seafood, jobs, and recreation for millions of anglers and for-hire recreational businesses. Recreational fishing effort is measured as “Angler Trips”, which is the number of recreational fishing trips people go on. Recreational fishing harvest is the number of fish caught and brought to shore on recreational fishing trips.
Recreational effort and harvest help us understand how recreational opportunities and seafood derived from our marine environment is changing over time. Fisheries managers use this data to set annual catch limits and fishing regulations, including season lengths, size, and daily catch limits. We present the total number of fish caught and angler trips annually for all marine fish in all regions.
Extreme Gauge values:
A value of zero on the gauge means that the average effort or harvest over the last 5 years of data was below any annual value up until that point, while a value of 100 would indicate the average value over that same period was above any annual value up until that point.
Data:
Recreational harvest and effort data pulled from National Summary Query at https://www.st.nmfs.noaa.gov/recreational-fisheries/data-and-documentation/queries/index Units of data are in Effort in Angler Days and Harvest in numbers of fish.