Definition of Threatened and Endangered Marine Mammals:
Some marine mammals face significant threats. The Endangered Species Act (ESA) aims to conserve endangered and threatened species and the ecosystems they depend on. Under the ESA, a species is considered endangered if it is in danger of extinction throughout all or a significant portion of its range, or threatened if it is likely to become endangered in the foreseeable future. We present the annual number of threatened and endangered marine mammals in all regions except the Caribbean. Data for the Southeast and Gulf of Mexico regions are combined.
Data:
Summary data tables from the NOAA Fisheries Protected Resources Species Information System were obtained from the database manager 3 April 2020. The number of ESA threatened and endangered species were summed for each region by year.
Definition of Strategic Stocks in the Marine Mammal Protection Act:
A strategic stock is defined by the Marine Mammal Protection Act as a marine mammal stock—For which the level of direct human-caused mortality exceeds the potential biological removal level; Which, based on the best available scientific information, is declining and is likely to be listed as a threatened species under the Endangered Species Act within the foreseeable future; or Which is listed as a threatened or endangered species under the ESA, or is designated as depleted under the MMPA. A depleted stock is defined by the MMPA as any case in which—The Secretary of Commerce, after consultation with the Marine Mammal Commission and the Committee of Scientific Advisors on Marine Mammals established under MMPA title II, determines that a species or population stock is below its optimum sustainable population; A State, to which authority for the conservation and management of a species or population stock is transferred under section 109, determines that such species or stock is below its optimum sustainable population; or A species or population stock is listed as an endangered species or a threatened species under the ESA. We present the annual number of strategic and depleted marine mammals in all regions except the Caribbean. Data for the Southeast and Gulf of Mexico regions are combined.
Data:
Data methods Summary data tables from the NOAA Fisheries Protected Resources Species Information System were obtained from the database manager 3 April 2020. The number of MMPA strategic and depleted stock species were summed for each region by year.
Marine mammal species listed as threatened or endangered under the Endangered Species Act
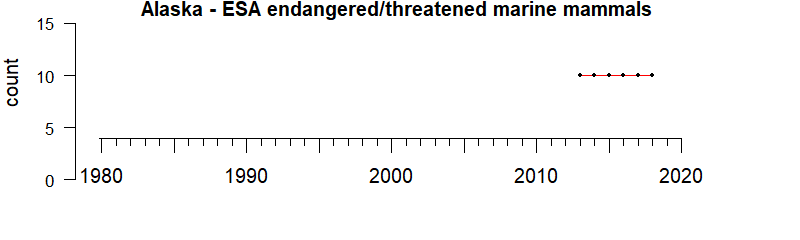
Alaska
Description of time series:
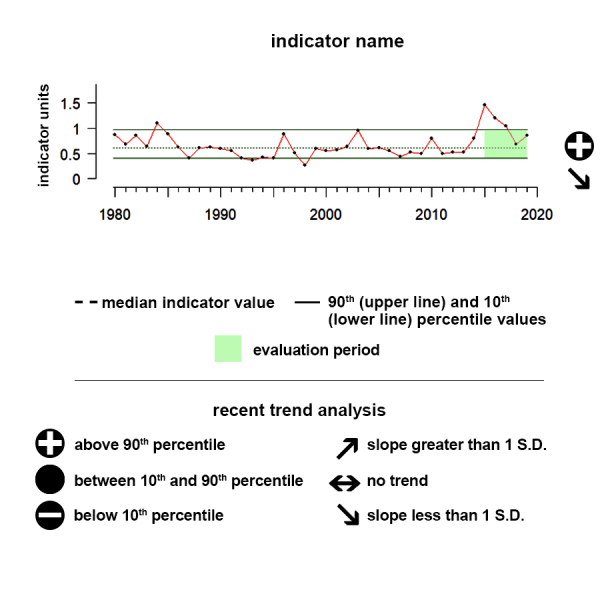
Trend analysis was not appropriate for ESA data.
Description of gauge:
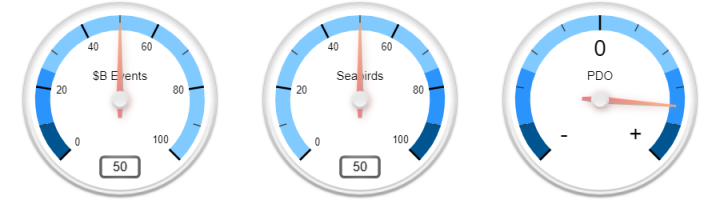
The Gauge value of 50 indicates that over the last five years, ESA threatened or endangered marine mammals average is the median value.
Description of Threatened and Endangered Marine mammals:
Some marine mammals face significant threats. The Endangered Species Act (ESA) aims to conserve endangered and threatened species and the ecosystems they depend on. Under the ESA, a species is considered endangered if it is in danger of extinction throughout all or a significant portion of its range, or threatened if it is likely to become endangered in the foreseeable future. We present the annual number of threatened and endangered marine mammals in all regions except the Caribbean. Data for the Southeast and Gulf of Mexico regions are combined.
Overall Scores mean the following:
High values of ESA threatened and endangered species are bad, low numbers are good.
- 0 - 10: The five-year ESA threatened or endangered marine mammals average is very low compared to the median value.
- 10 - 25: The five-year ESA threatened or endangered marine mammals is much lower than the median value.
- 25 - 50: The five-year ESA threatened or endangered marine mammals average is lower than the median value.
- 50: The five-year ESA threatened or endangered marine mammals average equals the median value.
- 50 - 75: The five-year ESA threatened or endangered marine mammals average is higher than the median value.
- 75 - 90: The five-year ESA threatened or endangered marine mammals average is much higher than the median value.
- 90 - 100: The five-year ESA threatened or endangered marine mammals average is very high compared to the median value.
Data:
Summary data tables from the NOAA Fisheries Protected Resources Species Information System were obtained from the database manager 3 April 2020. The number of ESA threatened and endangered species were summed for each region by year.
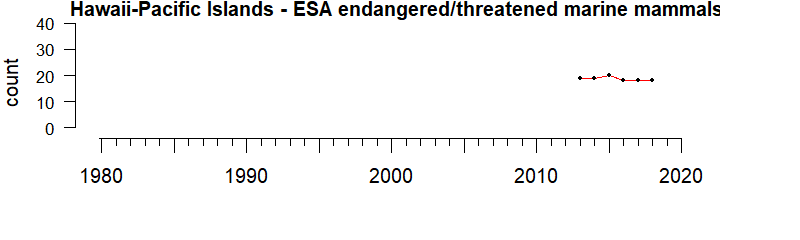
Hawaii-Pacific Islands
Description of time series:
Trend analysis was not appropriate for ESA data.
Description of gauge:
The Gauge value of 50 indicates that over the last five years, ESA threatened or endangered marine mammals average is the median value.
Description of Threatened and Endangered Marine mammals:
Some marine mammals face significant threats. The Endangered Species Act (ESA) aims to conserve endangered and threatened species and the ecosystems they depend on. Under the ESA, a species is considered endangered if it is in danger of extinction throughout all or a significant portion of its range, or threatened if it is likely to become endangered in the foreseeable future. We present the annual number of threatened and endangered marine mammals in all regions except the Caribbean. Data for the Southeast and Gulf of Mexico regions are combined.
Overall Scores mean the following:
High values of ESA threatened and endangered species are bad, low numbers are good.
- 0 - 10: The five-year ESA threatened or endangered marine mammals average is very low compared to the median value.
- 10 - 25: The five-year ESA threatened or endangered marine mammals is much lower than the median value.
- 25 - 50: The five-year ESA threatened or endangered marine mammals average is lower than the median value.
- 50: The five-year ESA threatened or endangered marine mammals average equals the median value.
- 50 - 75: The five-year ESA threatened or endangered marine mammals average is higher than the median value.
- 75 - 90: The five-year ESA threatened or endangered marine mammals average is much higher than the median value.
- 90 - 100: The five-year ESA threatened or endangered marine mammals average is very high compared to the median value.
Data:
Summary data tables from the NOAA Fisheries Protected Resources Species Information System were obtained from the database manager 3 April 2020. The number of ESA threatened and endangered species were summed for each region by year.
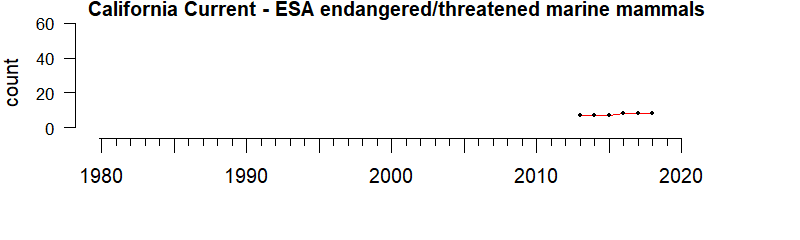
California Current
Description of time series:
Trend analysis was not appropriate for ESA data.
Description of gauge:
The Gauge value of 50 indicates that over the last five years, ESA threatened or endangered marine mammals average is the median value.
Description of Threatened and Endangered Marine mammals:
Some marine mammals face significant threats. The Endangered Species Act (ESA) aims to conserve endangered and threatened species and the ecosystems they depend on. Under the ESA, a species is considered endangered if it is in danger of extinction throughout all or a significant portion of its range, or threatened if it is likely to become endangered in the foreseeable future. We present the annual number of threatened and endangered marine mammals in all regions except the Caribbean. Data for the Southeast and Gulf of Mexico regions are combined.
Overall Scores mean the following:
High values of ESA threatened and endangered species are bad, low numbers are good.
- 0 - 10: The five-year ESA threatened or endangered marine mammals average is very low compared to the median value.
- 10 - 25: The five-year ESA threatened or endangered marine mammals is much lower than the median value.
- 25 - 50: The five-year ESA threatened or endangered marine mammals average is lower than the median value.
- 50: The five-year ESA threatened or endangered marine mammals average equals the median value.
- 50 - 75: The five-year ESA threatened or endangered marine mammals average is higher than the median value.
- 75 - 90: The five-year ESA threatened or endangered marine mammals average is much higher than the median value.
- 90 - 100: The five-year ESA threatened or endangered marine mammals average is very high compared to the median value.
Data:
Summary data tables from the NOAA Fisheries Protected Resources Species Information System were obtained from the database manager 3 April 2020. The number of ESA threatened and endangered species were summed for each region by year.
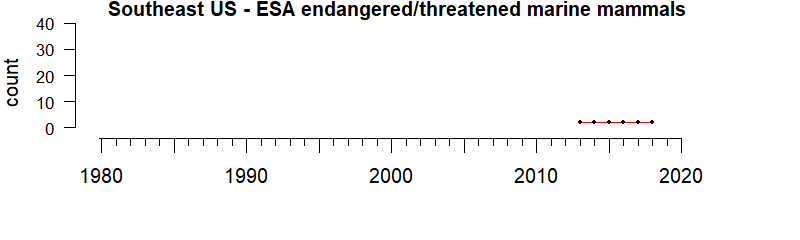
Southeast and Gulf of Mexico
Description of time series:
Trend analysis was not appropriate for ESA data.
Description of gauge:
The Gauge value of 50 indicates that over the last five years, ESA threatened or endangered marine mammals average is the median value.
Description of Threatened and Endangered Marine mammals:
Some marine mammals face significant threats. The Endangered Species Act (ESA) aims to conserve endangered and threatened species and the ecosystems they depend on. Under the ESA, a species is considered endangered if it is in danger of extinction throughout all or a significant portion of its range, or threatened if it is likely to become endangered in the foreseeable future. We present the annual number of threatened and endangered marine mammals in all regions except the Caribbean. Data for the Southeast and Gulf of Mexico regions are combined.
Overall Scores mean the following:
High values of ESA threatened and endangered species are bad, low numbers are good.
- 0 - 10: The five-year ESA threatened or endangered marine mammals average is very low compared to the median value.
- 10 - 25: The five-year ESA threatened or endangered marine mammals is much lower than the median value.
- 25 - 50: The five-year ESA threatened or endangered marine mammals average is lower than the median value.
- 50: The five-year ESA threatened or endangered marine mammals average equals the median value.
- 50 - 75: The five-year ESA threatened or endangered marine mammals average is higher than the median value.
- 75 - 90: The five-year ESA threatened or endangered marine mammals average is much higher than the median value.
- 90 - 100: The five-year ESA threatened or endangered marine mammals average is very high compared to the median value.
Data:
Summary data tables from the NOAA Fisheries Protected Resources Species Information System were obtained from the database manager 3 April 2020. The number of ESA threatened and endangered species were summed for each region by year.
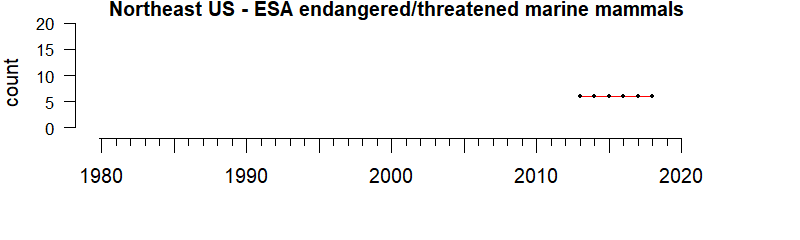
Northeast
Description of time series:
Trend analysis was not appropriate for ESA data.
Description of gauge:
The Gauge value of 50 indicates that over the last five years, ESA threatened or endangered marine mammals average is the median value.
Description of Threatened and Endangered Marine mammals:
Some marine mammals face significant threats. The Endangered Species Act (ESA) aims to conserve endangered and threatened species and the ecosystems they depend on. Under the ESA, a species is considered endangered if it is in danger of extinction throughout all or a significant portion of its range, or threatened if it is likely to become endangered in the foreseeable future. We present the annual number of threatened and endangered marine mammals in all regions except the Caribbean. Data for the Southeast and Gulf of Mexico regions are combined.
Overall Scores mean the following:
High values of ESA threatened and endangered species are bad, low numbers are good.
- 0 - 10: The five-year ESA threatened or endangered marine mammals average is very low compared to the median value.
- 10 - 25: The five-year ESA threatened or endangered marine mammals is much lower than the median value.
- 25 - 50: The five-year ESA threatened or endangered marine mammals average is lower than the median value.
- 50: The five-year ESA threatened or endangered marine mammals average equals the median value.
- 50 - 75: The five-year ESA threatened or endangered marine mammals average is higher than the median value.
- 75 - 90: The five-year ESA threatened or endangered marine mammals average is much higher than the median value.
- 90 - 100: The five-year ESA threatened or endangered marine mammals average is very high compared to the median value.
Data:
Summary data tables from the NOAA Fisheries Protected Resources Species Information System were obtained from the database manager 3 April 2020. The number of ESA threatened and endangered species were summed for each region by year.
Marine mammal stocks considered strategic/depleted under the Marine Mammal Protection Act
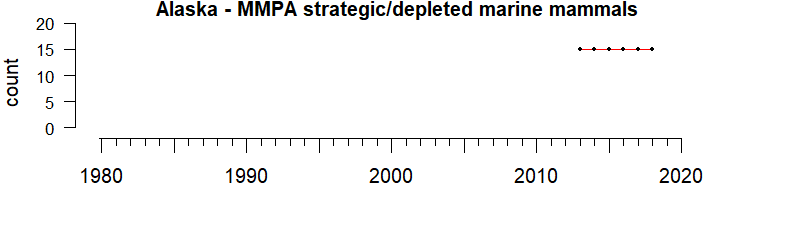
Alaska
Description of time series:
Trend analysis was not appropriate for MMPA data.
Description of gauge:
The Gauge value of 50 indicates that over the last five years, MMPA strategic and depleted marine mammals average is the median value.
Description of marine mammals depleted stocks (MMPA):
A strategic stock is defined by the Marine Mammal Protection Act as a marine mammal stock—For which the level of direct human-caused mortality exceeds the potential biological removal level; Which, based on the best available scientific information, is declining and is likely to be listed as a threatened species under the Endangered Species Act within the foreseeable future; or Which is listed as a threatened or endangered species under the ESA, or is designated as depleted under the MMPA.
A depleted stock is defined by the MMPA as any case in which—The Secretary of Commerce, after consultation with the Marine Mammal Commission and the Committee of Scientific Advisors on Marine Mammals established under MMPA title II, determines that a species or population stock is below its optimum sustainable population; a State, to which authority for the conservation and management of a species or population stock is transferred under section 109, determines that such species or stock is below its optimum sustainable population; or A species or population stock is listed as an endangered species or a threatened species under the ESA. We present the annual number of strategic and depleted marine mammals in all regions except the Caribbean. Data for the Southeast and Gulf of Mexico regions are combined.
Overall Scores mean the following:
- 0 - 10: The five-year MMPA strategic and depleted marine mammals average is very low compared to the median value.
- 10 - 25: The five-year MMPA strategic and depleted marine mammals average is much lower than the median value.
- 25 - 50: The five-year MMPA strategic and depleted marine mammals average is lower than the median value.
- 50: The five-year MMPA strategic and depleted marine mammals average equals the median value.
- 50 - 75: The five-year MMPA strategic and depleted marine mammals average is higher than the median value.
- 75 - 90: The five-year MMPA strategic and depleted marine mammals average is much higher than the median value.
- 90 - 100: The five-year MMPA strategic and depleted marine mammals average is very high compared to the median value.
Data:
Data methods Summary data tables from the NOAA Fisheries Protected Resources Species Information System were obtained from the database manager 3 April 2020. The number of MMPA strategic and depleted stock species were summed for each region by year.
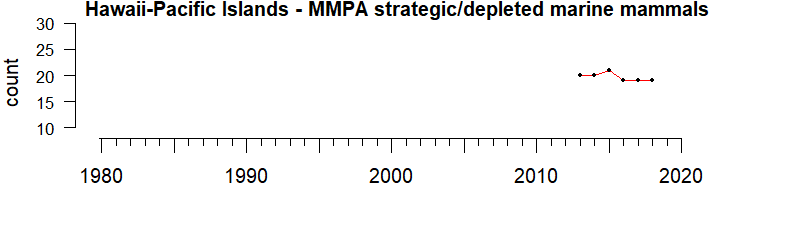
Hawaii-Pacific Islands
Description of time series:
Trend analysis was not appropriate for MMPA data.
Description of gauge:
The Gauge value of 50 indicates that over the last five years, MMPA strategic and depleted marine mammals average is the median value.
Description of marine mammals depleted stocks (MMPA):
A strategic stock is defined by the Marine Mammal Protection Act as a marine mammal stock—For which the level of direct human-caused mortality exceeds the potential biological removal level; Which, based on the best available scientific information, is declining and is likely to be listed as a threatened species under the Endangered Species Act within the foreseeable future; or Which is listed as a threatened or endangered species under the ESA, or is designated as depleted under the MMPA.
A depleted stock is defined by the MMPA as any case in which—The Secretary of Commerce, after consultation with the Marine Mammal Commission and the Committee of Scientific Advisors on Marine Mammals established under MMPA title II, determines that a species or population stock is below its optimum sustainable population; a State, to which authority for the conservation and management of a species or population stock is transferred under section 109, determines that such species or stock is below its optimum sustainable population; or A species or population stock is listed as an endangered species or a threatened species under the ESA. We present the annual number of strategic and depleted marine mammals in all regions except the Caribbean. Data for the Southeast and Gulf of Mexico regions are combined.
Overall Scores mean the following:
- 0 - 10: The five-year MMPA strategic and depleted marine mammals average is very low compared to the median value.
- 10 - 25: The five-year MMPA strategic and depleted marine mammals average is much lower than the median value.
- 25 - 50: The five-year MMPA strategic and depleted marine mammals average is lower than the median value.
- 50: The five-year MMPA strategic and depleted marine mammals average equals the median value.
- 50 - 75: The five-year MMPA strategic and depleted marine mammals average is higher than the median value.
- 75 - 90: The five-year MMPA strategic and depleted marine mammals average is much higher than the median value.
- 90 - 100: The five-year MMPA strategic and depleted marine mammals average is very high compared to the median value.
Data:
Data methods Summary data tables from the NOAA Fisheries Protected Resources Species Information System were obtained from the database manager 3 April 2020. The number of MMPA strategic and depleted stock species were summed for each region by year.
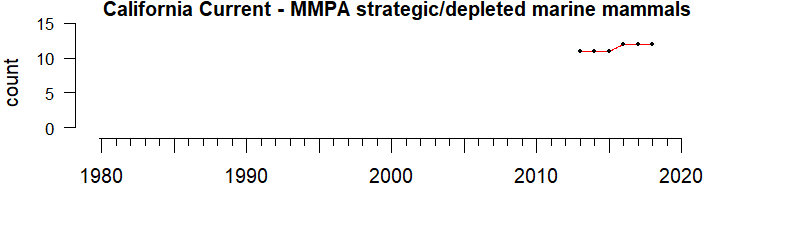
California Current
Description of time series:
Trend analysis was not appropriate for MMPA data.
Description of gauge:
The Gauge value of 50 indicates that over the last five years, MMPA strategic and depleted marine mammals average is the median value.
Description of marine mammals depleted stocks (MMPA):
A strategic stock is defined by the Marine Mammal Protection Act as a marine mammal stock—For which the level of direct human-caused mortality exceeds the potential biological removal level; Which, based on the best available scientific information, is declining and is likely to be listed as a threatened species under the Endangered Species Act within the foreseeable future; or Which is listed as a threatened or endangered species under the ESA, or is designated as depleted under the MMPA.
A depleted stock is defined by the MMPA as any case in which—The Secretary of Commerce, after consultation with the Marine Mammal Commission and the Committee of Scientific Advisors on Marine Mammals established under MMPA title II, determines that a species or population stock is below its optimum sustainable population; a State, to which authority for the conservation and management of a species or population stock is transferred under section 109, determines that such species or stock is below its optimum sustainable population; or A species or population stock is listed as an endangered species or a threatened species under the ESA. We present the annual number of strategic and depleted marine mammals in all regions except the Caribbean. Data for the Southeast and Gulf of Mexico regions are combined.
Overall Scores mean the following:
- 0 - 10: The five-year MMPA strategic and depleted marine mammals average is very low compared to the median value.
- 10 - 25: The five-year MMPA strategic and depleted marine mammals average is much lower than the median value.
- 25 - 50: The five-year MMPA strategic and depleted marine mammals average is lower than the median value.
- 50: The five-year MMPA strategic and depleted marine mammals average equals the median value.
- 50 - 75: The five-year MMPA strategic and depleted marine mammals average is higher than the median value.
- 75 - 90: The five-year MMPA strategic and depleted marine mammals average is much higher than the median value.
- 90 - 100: The five-year MMPA strategic and depleted marine mammals average is very high compared to the median value.
Data:
Data methods Summary data tables from the NOAA Fisheries Protected Resources Species Information System were obtained from the database manager 3 April 2020. The number of MMPA strategic and depleted stock species were summed for each region by year.
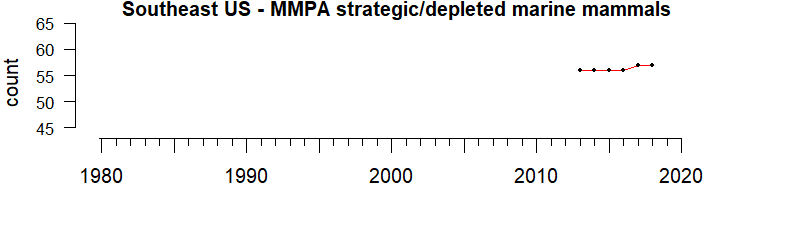
Southeast and Gulf of Mexico
Description of time series:
Trend analysis was not appropriate for MMPA data.
Description of gauge:
The Gauge value of 50 indicates that over the last five years, MMPA strategic and depleted marine mammals average is the median value.
Description of marine mammals depleted stocks (MMPA):
A strategic stock is defined by the Marine Mammal Protection Act as a marine mammal stock—For which the level of direct human-caused mortality exceeds the potential biological removal level; Which, based on the best available scientific information, is declining and is likely to be listed as a threatened species under the Endangered Species Act within the foreseeable future; or Which is listed as a threatened or endangered species under the ESA, or is designated as depleted under the MMPA.
A depleted stock is defined by the MMPA as any case in which—The Secretary of Commerce, after consultation with the Marine Mammal Commission and the Committee of Scientific Advisors on Marine Mammals established under MMPA title II, determines that a species or population stock is below its optimum sustainable population; a State, to which authority for the conservation and management of a species or population stock is transferred under section 109, determines that such species or stock is below its optimum sustainable population; or A species or population stock is listed as an endangered species or a threatened species under the ESA. We present the annual number of strategic and depleted marine mammals in all regions except the Caribbean. Data for the Southeast and Gulf of Mexico regions are combined.
Overall Scores mean the following:
- 0 - 10: The five-year MMPA strategic and depleted marine mammals average is very low compared to the median value.
- 10 - 25: The five-year MMPA strategic and depleted marine mammals average is much lower than the median value.
- 25 - 50: The five-year MMPA strategic and depleted marine mammals average is lower than the median value.
- 50: The five-year MMPA strategic and depleted marine mammals average equals the median value.
- 50 - 75: The five-year MMPA strategic and depleted marine mammals average is higher than the median value.
- 75 - 90: The five-year MMPA strategic and depleted marine mammals average is much higher than the median value.
- 90 - 100: The five-year MMPA strategic and depleted marine mammals average is very high compared to the median value.
Data:
Data methods Summary data tables from the NOAA Fisheries Protected Resources Species Information System were obtained from the database manager 3 April 2020. The number of MMPA strategic and depleted stock species were summed for each region by year.
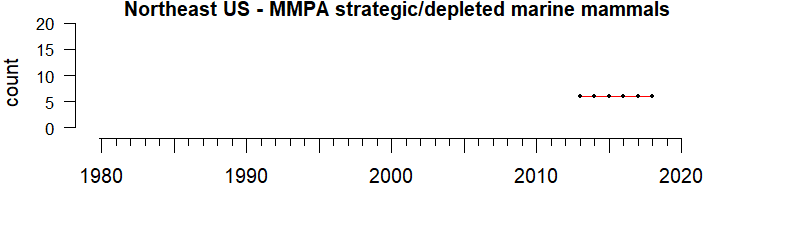
Northeast
Description of time series:
Trend analysis was not appropriate for MMPA data.
Description of gauge:
The Gauge value of 50 indicates that over the last five years, MMPA strategic and depleted marine mammals average is the median value.
Description of marine mammals depleted stocks (MMPA):
A strategic stock is defined by the Marine Mammal Protection Act as a marine mammal stock—For which the level of direct human-caused mortality exceeds the potential biological removal level; Which, based on the best available scientific information, is declining and is likely to be listed as a threatened species under the Endangered Species Act within the foreseeable future; or Which is listed as a threatened or endangered species under the ESA, or is designated as depleted under the MMPA.
A depleted stock is defined by the MMPA as any case in which—The Secretary of Commerce, after consultation with the Marine Mammal Commission and the Committee of Scientific Advisors on Marine Mammals established under MMPA title II, determines that a species or population stock is below its optimum sustainable population; a State, to which authority for the conservation and management of a species or population stock is transferred under section 109, determines that such species or stock is below its optimum sustainable population; or A species or population stock is listed as an endangered species or a threatened species under the ESA. We present the annual number of strategic and depleted marine mammals in all regions except the Caribbean. Data for the Southeast and Gulf of Mexico regions are combined.
Overall Scores mean the following:
- 0 - 10: The five-year MMPA strategic and depleted marine mammals average is very low compared to the median value.
- 10 - 25: The five-year MMPA strategic and depleted marine mammals average is much lower than the median value.
- 25 - 50: The five-year MMPA strategic and depleted marine mammals average is lower than the median value.
- 50: The five-year MMPA strategic and depleted marine mammals average equals the median value.
- 50 - 75: The five-year MMPA strategic and depleted marine mammals average is higher than the median value.
- 75 - 90: The five-year MMPA strategic and depleted marine mammals average is much higher than the median value.
- 90 - 100: The five-year MMPA strategic and depleted marine mammals average is very high compared to the median value.
Data:
Data methods Summary data tables from the NOAA Fisheries Protected Resources Species Information System were obtained from the database manager 3 April 2020. The number of MMPA strategic and depleted stock species were summed for each region by year.