
Description of Climate Indicators
Broadscale climate indicators are measures of the temperature, currents, winds, and other factors over long periods of time (months to decades) in and over a large, specific geographic region of the ocean. These indices identify naturally occurring variability of the climate, occurring over periods of years to decades. Six major climate indicators presented here are the El Niño-Southern Oscillation (Oceanic Niño Index, ONI ), Multivariate ENSO Index (MEI), Pacific Decadal Oscillation (PDO), East-Pacific-North Pacific teleconnection pattern (EP-NP), Atlantic Multidecadal Oscillation (AMO), and the North Atlantic Oscillation (NAO). Though each of these broadscale climate indicators are based within specific ocean regions and are measured across different time scales, all can impact people and ecosystems across the globe. Interactions between the ocean and atmosphere alter weather around the world and can result in severe storms or mild weather, drought or flooding. Beyond “just” influencing the weather and ocean conditions, these changes can produce secondary results that influence food supplies and prices, forest fires and flooding, and create additional economic and political consequences.
Data Sources
All of the indices presented here are calculated by NOAA and their partners and hosted on index-specific websites that can be accessed here: El Niño-Southern Oscillation (NOAA PSL), Multivariate ENSO Index (MEI, NOAA PSL), Pacific Decadal Oscillation (NOAA NCEI), East-Pacific-North Pacific teleconnection pattern (Columbia University), Atlantic Multidecadal Oscillation (NOAA PSL), and the North Atlantic Oscillation (NOAA NCEI)
For the most up to date data, please reference the original sources above.
Understanding the Time series plots
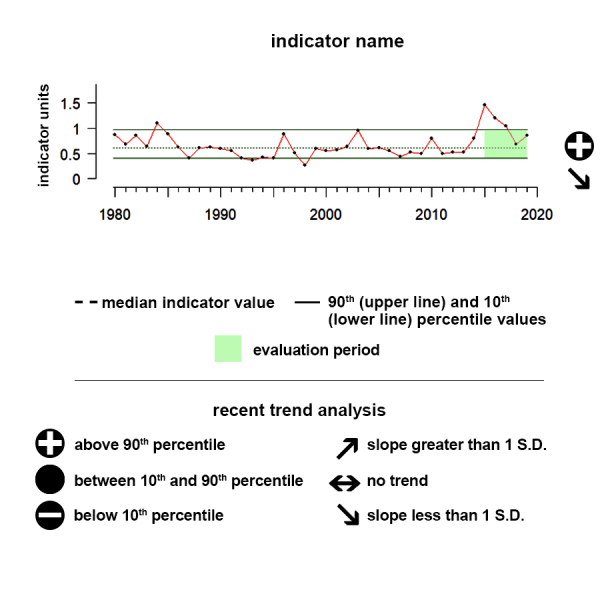
Time series plots show the changes in each indicator as a function of time, over the period 1980-present. Each plot also shows horizontal lines that indicate the median (middle) value of that indicator, as well as the 10th and 90th percentiles, each calculated for the entire period of measurement. Time series plots were only developed for datasets with at least 10 years of data. Two symbols located to the right of each plot describe how recent values of an indicator compare against the overall series. A black circle indicates whether the indicator values over the last five years are on average above the series 90th percentile (plus sign), below the 10th percentile (minus sign), or between those two values (solid circle). Beneath that an arrow reflects the trend of the indicator over the last five years; an increase or decrease greater than one standard deviation is reflected in upward or downward arrows respectively, while a change of less than one standard deviation is recorded by a left-right arrow.

El Niño-Southern Oscillation (Oceanic Niño Index)
After an El Nino event that spanned much of 2023, conditions transitioned to ENSO neutral in the spring of 2024 and have remained neutral since then.
Values correspond to Index scores
Description of time series:
The Oceanic Niño Index (ONI) is NOAA’s primary index for monitoring the El Niño-Southern Oscillation climate pattern. It is based on Sea Surface Temperature values in a particular part of the central equatorial Pacific, which scientists refer to as the Niño 3.4 region. Positive values of this indicator, greater than +0.5, indicate warm El Niño conditions, while negative values, less than -0.5, indicate cold La Niña conditions. Values between +0.5 and -0.5 are considered ENSO neutral. The ONI shifted from La Nina conditions to neutral conditions in early 2023, and with continued sea-surface warming now indicate that an El Nino has begun.
Description of El Niño-Southern Oscillation (ENSO):
El Niño and La Niña are opposite phases of the El Niño-Southern Oscillation (ENSO), a cyclical condition occurring across the Equatorial Pacific Ocean with worldwide effects on weather and climate. During an El Niño, surface waters in the central and eastern equatorial Pacific become warmer than average and the trade winds - blowing from east to west - greatly weaken. During a La Niña, surface waters in the central and eastern equatorial Pacific become much cooler, and the trade winds become much stronger. El Niños and La Niñas generally last about 6 months but can extend up to 2 years. The time between events is irregular, but generally varies between 2-7 years. To monitor ENSO conditions, NOAA operates a network of buoys, which measure temperature, currents, and winds in the equatorial Pacific.
This climate pattern impacts people and ecosystems around the world by affecting large scale areas of tropical convection, and by extension, the jet streams. Interactions between the ocean and atmosphere alter weather globally and can result in severe storms or mild weather, drought or flooding. Beyond “just” influencing the weather and ocean conditions, these changes can produce secondary results that influence food supplies and prices, forest fires and flooding, and create additional economic and political consequences. For example, along the west coast of the U.S., warm El Niño events are known to inhibit the delivery of nutrients from subsurface waters, suppressing local fisheries. El Niño events are typically associated with fewer hurricanes in the Atlantic while La Niña events typically result in greater numbers of Atlantic hurricanes.
Data Background:
ENSO ONI data was accessed from NOAA’s Climate Prediction Center (https://origin.cpc.ncep.noaa.gov/products/analysis_monitoring/ensostuff/ONI_v5.php). The data are plotted in degrees Celsius and represent Sea Surface Temperature anomalies averaged across the so-called Niño 3.4 region in the east-central tropical Pacific between 120°-170°W and 5°S-5°N .
Multivariate El Niño-Southern Oscillation Index (MEI)
The MEI indicator shifted from neutral to negative in the spring of 2024 and has been indicating La Nina conditions since then.
Values correspond to Index scores
Description of time series:
Like the Oceanic Niño Index, positive MEI values indicate warm, El Niño conditions and negative MEI values indicate cold, La Niña conditions. The MEI indicator shifted from negative to positive during the summer of 2023, and has since shown El Nino conditions.
Description of Multivariate El Niño-Southern Oscillation Index:
The Multivariate El Niño-Southern Oscillation Index (MEI) is a more holistic representation of the atmospheric and oceanic conditions that occur during ENSO events and characterizes their intensity. MEI is determined from five variables from the central and eastern equatorial Pacific (Sea-level pressure, surface wind components, sea surface temperature,, and cloudiness), while ENSO ONI is only based on sea surface temperature. This index is calculated twelve times per year for each sliding bi-monthly season i.e. Dec-Jan, Jan-Feb, Feb-Mar, etc.
Data Background:
MEI data was accessed from NOAA’s Earth Systems Research Laboratory (https://psl.noaa.gov/enso/mei/). The data plotted are unitless anomalies.
Pacific Decadal Oscillation (PDO)
During the last five years, the PDO indicator has trended downward, shifting from positive phase to negative phase in 2019.
Values correspond to Index scores
Description of time series:
Positive PDO values typically mean cool surface water conditions in the interior of the North Pacific Ocean and warm surface waters along the North American Pacific Coast while negative PDO conditions typically mean warm surface water conditions in the interior to the North Pacific Ocean and cool surface waters along the North American Pacific Coast. During the last five years, the PDO indicator has trended downward, shifting from positive phase to negative phase in 2019.
Description of Pacific Decadal Oscillation (PDO):
The Pacific Decadal Oscillation (PDO) is a long-term pattern of Pacific climate variability that comprises multiple physical forcing mechanisms. The extreme phases of this climatic condition are classified as warm or cool, based on deviations from average ocean temperature in the northeast and central North Pacific Ocean. When the PDO has a positive value, sea surface temperatures are below average (cool) in the interior North Pacific and warm along the Pacific Coast. When the PDO has a negative value, the climate patterns are reversed, with above average sea surface temperatures in the interior and sea surface temperatures below average along the North American coast. On shorter timescales a positive (negative) PDO is often related to El Niño (La Niña). The PDO waxes and wanes on longer timescales as well; warm and cold phases may persist for decades. Major changes in northeast Pacific marine ecosystems have been correlated with phase changes in the PDO. Warm phases have seen enhanced coastal ocean biological productivity in Alaska and inhibited productivity off the west coast of the United States, while cold PDO phases have seen the opposite, north-south pattern of marine ecosystem productivity. We present data from the Pacific Islands, Alaska, and California Current regions
Data Background:
Climate indicator data was accessed from the NOAA NCEI (https://www.NCEI.noaa.gov/teleconnections/pdo/data.csv). The data plotted are unitless and based on Sea Surface Temperature anomalies averaged across a given region.
East Pacific - North Pacific Teleconnection Pattern Index
During the last five years, the EP-NP indicator has shifted from mostly positive to mostly negative.
Values correspond to Index scores
Description of time series:
Positive EP-NP values mean above-average surface temperatures over the eastern North Pacific, and below-average temperatures over the central North Pacific and eastern North America and the opposite for negative EP-NP values. During the last five years, the EP-NP indicator has shifted from mostly positive to mostly negative.
Description of East Pacific/ North Pacific Teleconnection Pattern Index:
The East Pacific/ North Pacific Teleconnection Pattern Index is a measure of climate variability. Positive EP-NP values mean above-average surface temperatures over the eastern North Pacific, and below-average temperatures over the central North Pacific and eastern North America and the opposite for negative EP-NP values.
This climate condition impacts people and ecosystems across the globe and each of the indicators presented here. Interactions between the ocean and atmosphere alter weather around the world and can result in severe storms or mild weather, drought, or flooding. Beyond “just” influencing the weather and ocean conditions, these changes can produce secondary results that influence food supplies and prices, forest fires and flooding, and create additional economic and political consequences. The positive phase of the EP-NP pattern is associated with above-average surface temperatures over the eastern North Pacific, and below-average temperatures over the central North Pacific and eastern North America. The main precipitation anomalies associated with this pattern reflect above-average precipitation in the area north of Hawaii and below-average precipitation over southwestern Canada
Data Background:
Climate indicator data was accessed from NOAA NCEP (https://ftp.cpc.ncep.noaa.gov/wd52dg/data/indices/epnp_index.tim). The data plotted are unitless anomalies.
North Atlantic Oscillation (NAO)
During the last five years, the NAO indicator shows no significant trend but has remained largely in the negative phase.
Values correspond to Index scores
Description of time series:
Positive NAO values mean significantly warmer winters over much of the eastern U.S. and northern Europe and negative NAO values can mean cold winter outbreaks and heavy snowstorms. During the last five years, the NAO indicator shows no significant trend but has remained largely in the negative phase.
Description of North Atlantic Oscillation (NAO):
The North Atlantic Oscillation (NAO) Index measures the relative strengths and positions of a permanent low-pressure system over Iceland (the Icelandic Low) and a permanent high-pressure system over the Azores (the Azores High). When the index is positive (NAO+) significantly warmer winters can occur over much of the eastern U.S. This prevents nutrient-rich upwelling, which reduces productivity. When the NAO index is negative, the upper central and eastern portions of the United States can incur winter cold outbreaks and heavy snowstorms. This climate condition impacts people and ecosystems across the globe and each of the indicators presented here. Interactions between the ocean and atmosphere alter weather around the world and can result in severe storms or mild weather, drought, or flooding. Beyond “just” influencing the weather and ocean conditions, these changes can produce secondary results that influence food supplies and prices, forest fires and flooding, and create additional economic and political consequences.
Data:
Climate indicator data was accessed from the NOAA NCEI (https://www.NCEI.noaa.gov/teleconnections/nao). The data plotted are unitless anomalies and averaged across a given region.
Atlantic Multidecadal Oscillation
During the last five years, the AMO has largely been in a positive phase, and continues to trend upward.
Values correspond to Index scores
Description of time series:
Positive AMO values indicate the warm phase, during which surface waters in the North Atlantic Ocean are warmer than average, and negative AMO values indicate the cold phase, during which surface waters in the North Atlantic Ocean are cooler than average. During the last five years, the AMO has largely been in a positive phase, and continues to trend upward.
Description of Atlantic Multidecadal Oscillation (AMO):
The Atlantic Multidecadal Oscillation is a series of long-duration changes in the North Atlantic sea surface temperature, with cool and warm phases that may last for 20-40 years. Most of the Atlantic between the equator and Greenland changes in unison. Some areas of the North Pacific also seem to be affected. This broadscale climate condition affects air temperatures and rainfall over much of the Northern Hemisphere. It is also related to major droughts in the Midwest and the Southwest of the U.S. In the warm phase, these droughts tend to be more frequent and/or severe. Vice-versa for the cold phase. During the warm phases the number of tropical storms that mature into severe hurricanes is much greater than during cool phases. Despite the association of AMO with multiple weather and climate impacts, recent scientific debate has questioned whether this indicator is a natural climate variation, like the other climate indicators presented here, or a response of the climate system to human-caused climate change. Whether natural or a result of human-caused climate change, AMO is a useful feature for tracking large-scale weather and climate events. This climate condition impacts people and ecosystems across the globe and each of the indicators presented here. Interactions between the ocean and atmosphere alter weather around the world and can result in severe storms or mild weather, drought, or flooding. Beyond “just” influencing the weather and ocean conditions, these changes can produce secondary results that influence food supplies and prices, forest fires and flooding, and create additional economic and political consequences
Data Background:
Climate indicator data was accessed from NOAA’s Earth Systems Research Laboratory (https://www.esrl.noaa.gov/psd/data/timeseries/AMO/). The data plotted are unitless anomalies and averaged across a given region
Resources
Climate.gov
NOAA Climate.gov provides science and information for a climate-smart nation. Americans’ health, security, and economic well-being are closely linked to climate and weather. People want and need information to help them make decisions on how to manage climate-related risks and opportunities they face.
NOAA Climate.gov is a source of timely and authoritative scientific data and information about climate. Our goals are to promote public understanding of climate science and climate-related events, to make our data products and services easy to access and use, to provide climate-related support to the private sector and the Nation’s economy, and to serve people making climate-related decisions with tools and resources that help them answer specific questions.

Climate Prediction Center: EP-NP
The East Pacific - North Pacific (EP- NP) pattern is a Spring-Summer-Fall pattern with three main anomaly centers. The positive phase of this pattern features positive height anomalies located over Alaska/ Western Canada, and negative anomalies over the central North Pacific and eastern North America. Strong positive phases of the EP-NP pattern are associated with a southward shift and intensification of the Pacific jet stream from eastern Asia to the eastern North Pacific, followed downstream by an enhanced anticyclonic circulation over western North America, and by an enhanced cyclonic circulation over the eastern United States. Strong negative phases of the pattern are associated with circulation anomalies of opposite sign in these regions.

Physical Sciences Laboratory: ENSO Resources
The NOAA Physical Sciences Laboratory studies multiple aspects of ENSO including its precursors, prediction, diversity, and climate and ecosystem impacts. This information can help keep communities safe and guide decisions related to issues such as water management, emergency planning, and ecosystem resilience.

The Pacific Decadal Oscillation (PDO)
The Pacific Decadal Oscillation (PDO) is often described as a long-lived El Niño-like pattern of Pacific climate variability (Zhang et al. 1997). As seen with the better-known El Niño/Southern Oscillation (ENSO), extremes in the PDO pattern are marked by widespread variations in the Pacific Basin and the North American climate. In parallel with the ENSO phenomenon, the extreme phases of the PDO have been classified as being either warm or cool, as defined by ocean temperature anomalies in the northeast and tropical Pacific Ocean. When SSTs are anomalously cool in the interior North Pacific and warm along the Pacific Coast, and when sea level pressures are below average over the North Pacific, the PDO has a positive value. When the climate anomaly patterns are reversed, with warm SST anomalies in the interior and cool SST anomalies along the North American coast, or above average sea level pressures over the North Pacific, the PDO has a negative value (Courtesy of Mantua, 1999).

Climate Prediction Center: ENSO tutorial
Links about the ENSO Cycle from the Climate Prediction Center

Climate Prediction Center: ENSO data and fact sheets
Fact Sheets and educational materials about the ENSO Cycle from the Climate Prediction Center

Multivariate ENSO Index Version 2 (MEI.v2)
The El Niño/Southern Oscillation (ENSO) - a naturally occurring anomalous state of tropical Pacific coupled ocean-atmosphere conditions - is the primary predictor for global climate disruptions. These can persist over several seasons and thereby produce severe regional effects. An appraisal of the real-time status of ENSO is thus important for a host of climate services that inform societal responses and trigger policy actions for water supply, food security, health, and public safety. The MEI, which combines both oceanic and atmospheric variables, facilitates in a single index an assessment of ENSO. It especially gives real-time indications of ENSO intensity, and through historical analysis - provides a context for meaningful comparative study of evolving conditions.

AMO (Atlantic Multidecadal Oscillation) Index
The timeseries are calculated from the Kaplan SST dataset which is updated monthly. It is basically an index of the N Atlantic temperatures. Time series are created; a smoothed version and an unsmoothed version. In addition, two files starting at 1948 are produced to be used in the Correlation webpages.

NCEI: North Atlantic Oscillation
One of the most prominent teleconnection patterns in all seasons is the North Atlantic Oscillation (NAO) (Barnston and Livezey 1987). The NOA combines parts of the East-Atlantic and West Atlantic patterns originally identified by Wallace and Gutzler (1981) for the winter season. The NAO consists of a north-south dipole of anomalies, with one center located over Greenland and the other center of opposite sign spanning the central latitudes of the North Atlantic between 35�N and 40�N.

The Global Climate Indicators - UN Global Climate Observing System
GCOS regularly assesses the status of global climate observations and produces guidance for its improvement. GCOS works towards a world where climate observations are accurate and sustained, and access to climate data is free and open.

Climate Change Indicators in the United States - EPA
EPA partners with more than 40 data contributors from various government agencies, academic institutions, and other organizations to compile a key set of indicators related to the causes and effects of climate change. The indicators are published in EPA's report, Climate Change Indicators in the United States, available on this website and in print.

NOAA's Climate Program Office
To predict the weather — including extreme events — we have to understand both climate variability and change. NOAA OAR’s Climate Program Office (CPO) advances understanding and prediction of climate, and leverages the science to help Americans plan and respond. CPO is never policy prescriptive — CPO’s information doesn’t tell us what to do; rather, it tells us what has happened, what’s likely to happen, why, and with what impacts. CPO’s work underpins and supports the development of the quadrennial U.S. National Climate Assessment, which was mandated by Congress in the Global Change Research Act of 1990.

NCEI Climate at a Glance
The global component of Climate at a Glance (GCAG) provides global-scale temperature information using data from NOAA's Merged Land Ocean Global Surface Temperature Analysis (NOAAGlobalTemp), which uses comprehensive data collections of increased global coverage over land (Global Historical Climatology Network-Monthly) and ocean (Extended Reconstructed Sea Surface Temperature) surfaces. The tool provides near real-time analysis of monthly and annual temperatures for the globe and is intended for the study of climate variability and change. Data is provided globally, by hemisphere, and by land and ocean surface components. The interactive mapping tool allows analysis of the spatial patterns of global temperature anomalies and regional temperature analysis. Recent data are preliminary and may be modified after appropriate quality control has been performed.