
Description of Zooplankton:
Zooplankton are a diverse group of animals found in oceans, bays, and estuaries. By eating phytoplankton, and each other, zooplankton play a significant role in the transfer of materials and energy up the oceanic food web (e.g., fish, birds, marine mammals, humans.) Like phytoplankton, environmental and oceanographic factors continuously influence the abundance, composition and spatial distribution of zooplankton. These include the abundance and type of phytoplankton present in the water, as well as the water’s temperature, salinity, oxygen, and pH. Zooplankton can rapidly react to changes in their environment. For this reason monitoring the status of zooplankton is essential for detecting changes in, and evaluating the status of ocean ecosystems. We present the annual average total biovolume of zooplankton in the Alaska, California Current, Gulf of Mexico and Northeast regions.
Data:
Zooplankton data for each region were obtained from the NOAA Fisheries Coastal & Oceanic Plankton Ecology, Production, & Observations Database, an integrated data set of quality-controlled, globally distributed plankton biomass and abundance data with common biomass units and served in a common electronic format with supporting documentation and access software. Source: https://www.st.nmfs.noaa.gov/copepod/about/about-copepod.html
Alaska
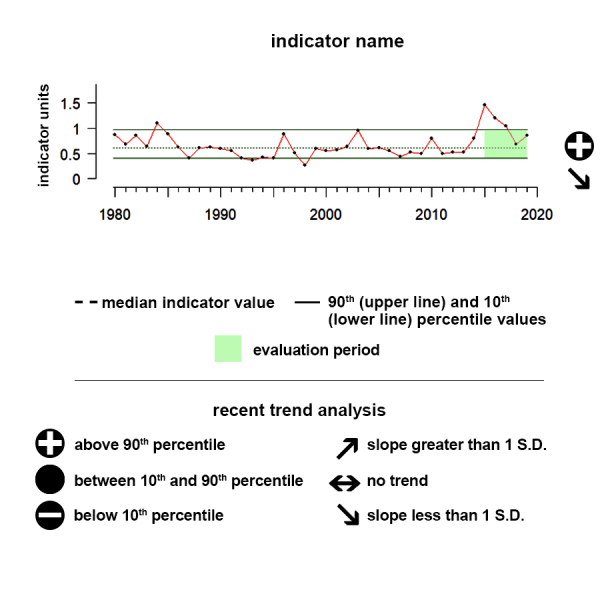
Description of time series:
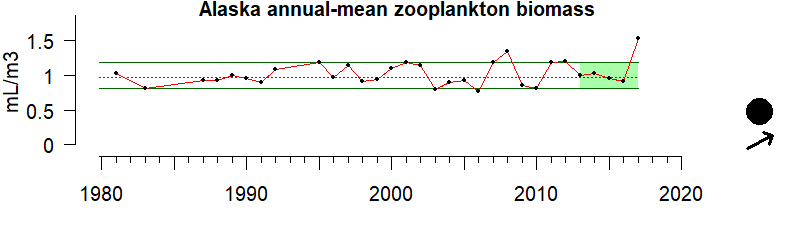
During the last five years the zooplankton biomass indicator shows a significant upward trend.
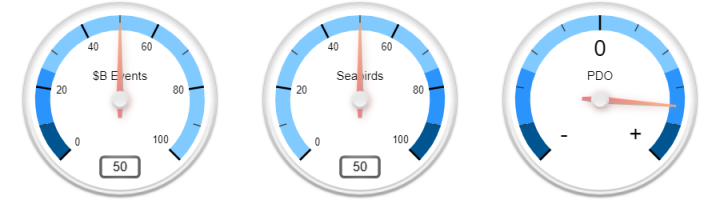
Description of gauge:
The gauge value of 65 indicates that over the last five years, average zooplankton biomass has been higher than the median value.
Description of Zooplankton:
Zooplankton are a diverse group of animals found in oceans, bays, and estuaries. By eating phytoplankton, and each other, zooplankton play a significant role in the transfer of materials and energy up the oceanic food web (e.g., fish, birds, marine mammals, humans.) Like phytoplankton, environmental and oceanographic factors continuously influence the abundance, composition and spatial distribution of zooplankton. These include the abundance and type of phytoplankton present in the water, as well as the water’s temperature, salinity, oxygen, and pH. Zooplankton can rapidly react to changes in their environment. For this reason monitoring the status of zooplankton is essential for detecting changes in, and evaluating the status of ocean ecosystems. We present the annual average total biovolume of zooplankton in the Alaska, California Current, Gulf of Mexico and Northeast regions.
Overall Scores mean the following:
- 0 - 10: The five-year zooplankton biomass average is very low compared to the median value.
- 10 - 25: The five-year zooplankton biomass average is much lower than the median value.
- 25 - 50: The five-year zooplankton biomass average is lower than the median value.
- 50: The five-year zooplankton biomass average equals the median value.
- 50 - 75: The five-year zooplankton biomass average is higher than the median value.
- 75 - 90: The five-year zooplankton biomass average is much higher than the median value.
- 90 - 100: The five-year zooplankton biomass average is very high compared to the median value.
High values of zooplankton can be good (lots of lipid rich colder water species) or bad (lots of lipid poor warmer water species), depending on the region.
Data:
Zooplankton data for each region were obtained from the NOAA Fisheries Coastal & Oceanic Plankton Ecology, Production, & Observations Database, an integrated data set of quality-controlled, globally distributed plankton biomass and abundance data with common biomass units and served in a common electronic format with supporting documentation and access software. Source: https://www.st.nmfs.noaa.gov/copepod/about/about-copepod.html
California Current
Description of time series:
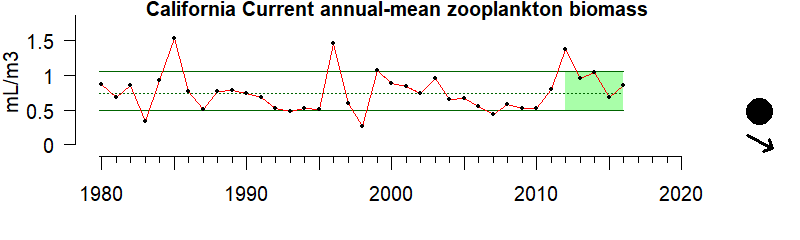
During the last five years the zooplankton biomass indicator shows a significant downward trend.
Description of gauge:
The gauge value of 86 indicates that over the last five years, average zooplankton biomass has been much higher than the median value.
Description of Zooplankton:
Zooplankton are a diverse group of animals found in oceans, bays, and estuaries. By eating phytoplankton, and each other, zooplankton play a significant role in the transfer of materials and energy up the oceanic food web (e.g., fish, birds, marine mammals, humans.) Like phytoplankton, environmental and oceanographic factors continuously influence the abundance, composition and spatial distribution of zooplankton. These include the abundance and type of phytoplankton present in the water, as well as the water’s temperature, salinity, oxygen, and pH. Zooplankton can rapidly react to changes in their environment. For this reason monitoring the status of zooplankton is essential for detecting changes in, and evaluating the status of ocean ecosystems. We present the annual average total biovolume of zooplankton in the Alaska, California Current, Gulf of Mexico and Northeast regions.
Overall Scores mean the following:
- 0 - 10: The five-year zooplankton biomass average is very low compared to the median value.
- 10 - 25: The five-year zooplankton biomass average is much lower than the median value.
- 25 - 50: The five-year zooplankton biomass average is lower than the median value.
- 50: The five-year zooplankton biomass average equals the median value.
- 50 - 75: The five-year zooplankton biomass average is higher than the median value.
- 75 - 90: The five-year zooplankton biomass average is much higher than the median value.
- 90 - 100: The five-year zooplankton biomass average is very high compared to the median value.
High values of zooplankton can be good (lots of lipid rich colder water species) or bad (lots of lipid poor warmer water species), depending on the region.
Data:
Zooplankton data for each region were obtained from the NOAA Fisheries Coastal & Oceanic Plankton Ecology, Production, & Observations Database, an integrated data set of quality-controlled, globally distributed plankton biomass and abundance data with common biomass units and served in a common electronic format with supporting documentation and access software. Source: https://www.st.nmfs.noaa.gov/copepod/about/about-copepod.html
Gulf of Mexico
Description of time series:
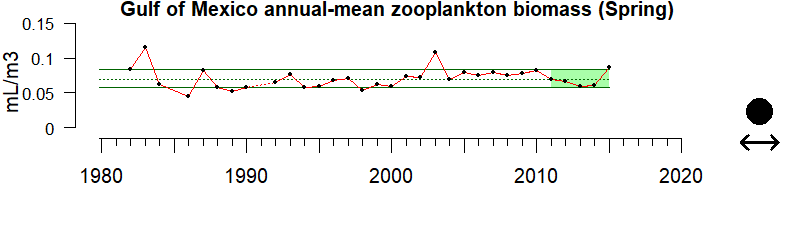
During the last five years the zooplankton biomass indicator shows no significant trend.
Description of gauge:
The gauge value of 47 indicates that over the last five years, average zooplankton biomass has been close to the median value.
Description of Zooplankton:
Zooplankton are a diverse group of animals found in oceans, bays, and estuaries. By eating phytoplankton, and each other, zooplankton play a significant role in the transfer of materials and energy up the oceanic food web (e.g., fish, birds, marine mammals, humans.) Like phytoplankton, environmental and oceanographic factors continuously influence the abundance, composition and spatial distribution of zooplankton. These include the abundance and type of phytoplankton present in the water, as well as the water’s temperature, salinity, oxygen, and pH. Zooplankton can rapidly react to changes in their environment. For this reason monitoring the status of zooplankton is essential for detecting changes in, and evaluating the status of ocean ecosystems. We present the annual average total biovolume of zooplankton in the Alaska, California Current, Gulf of Mexico and Northeast regions.
Overall Scores mean the following:
- 0 - 10: The five-year zooplankton biomass average is very low compared to the median value.
- 10 - 25: The five-year zooplankton biomass average is much lower than the median value.
- 25 - 50: The five-year zooplankton biomass average is lower than the median value.
- 50: The five-year zooplankton biomass average equals the median value.
- 50 - 75: The five-year zooplankton biomass average is higher than the median value.
- 75 - 90: The five-year zooplankton biomass average is much higher than the median value.
- 90 - 100: The five-year zooplankton biomass average is very high compared to the median value.
High values of zooplankton can be good (lots of lipid rich colder water species) or bad (lots of lipid poor warmer water species), depending on the region.
Data:
Zooplankton data for each region were obtained from the NOAA Fisheries Coastal & Oceanic Plankton Ecology, Production, & Observations Database, an integrated data set of quality-controlled, globally distributed plankton biomass and abundance data with common biomass units and served in a common electronic format with supporting documentation and access software. Source: https://www.st.nmfs.noaa.gov/copepod/about/about-copepod.html
Northeastern US
Description of time series:
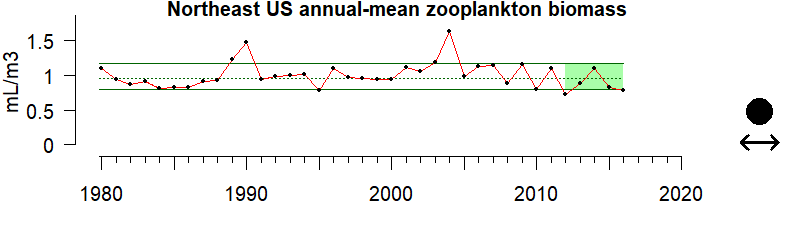
During the last five years the zooplankton biomass indicator shows no significant trend.
Description of gauge:
The gauge value of 24 indicates that over the last five years, average zooplankton biomass has been much lower than the median value.
Description of Zooplankton:
Zooplankton are a diverse group of animals found in oceans, bays, and estuaries. By eating phytoplankton, and each other, zooplankton play a significant role in the transfer of materials and energy up the oceanic food web (e.g., fish, birds, marine mammals, humans.) Like phytoplankton, environmental and oceanographic factors continuously influence the abundance, composition and spatial distribution of zooplankton. These include the abundance and type of phytoplankton present in the water, as well as the water’s temperature, salinity, oxygen, and pH. Zooplankton can rapidly react to changes in their environment. For this reason monitoring the status of zooplankton is essential for detecting changes in, and evaluating the status of ocean ecosystems. We present the annual average total biovolume of zooplankton in the Alaska, California Current, Gulf of Mexico and Northeast regions.
Overall Scores mean the following:
- 0 - 10: The five-year zooplankton biomass average is very low compared to the median value.
- 10 - 25: The five-year zooplankton biomass average is much lower than the median value.
- 25 - 50: The five-year zooplankton biomass average is lower than the median value.
- 50: The five-year zooplankton biomass average equals the median value.
- 50 - 75: The five-year zooplankton biomass average is higher than the median value.
- 75 - 90: The five-year zooplankton biomass average is much higher than the median value.
- 90 - 100: The five-year zooplankton biomass average is very high compared to the median value.
High values of zooplankton can be good (lots of lipid rich colder water species) or bad (lots of lipid poor warmer water species), depending on the region.
Data:
Zooplankton data for each region were obtained from the NOAA Fisheries Coastal & Oceanic Plankton Ecology, Production, & Observations Database, an integrated data set of quality-controlled, globally distributed plankton biomass and abundance data with common biomass units and served in a common electronic format with supporting documentation and access software. Source: https://www.st.nmfs.noaa.gov/copepod/about/about-copepod.html
Resources
NOAA COPEPOD database
The Coastal & Oceanic Plankton Ecology, Production & Observation Database (COPEPOD) offers a variety of searching options, designed to help you find the data you desire via a variety of pathways.
Plankton Data and Visualization
The COPEPOD project was started in 2004 to integrate the vast collection of zooplankton data from NOAA Fisheries’ ecosystem monitoring programs into a U.S.-wide, and subsequently, global database of zooplankton and phytoplankton abundance, biomass, and composition. COPEPOD features hundreds of data sets from NOAA Fisheries, international, and historical plankton sampling efforts. Regional compilation and global gridded products are also available from these data.
Northwest Fisheries Science Center Zooplankton
These highly magnified images of marine organisms from Puget Sound and the Pacific Ocean were taken with a scanning electron microscope (SEM) at National Oceanic and Atmospheric Administration (NOAA), Northwest Fisheries Science Center (NWFSC) in Seattle. Occasionally, the samples examined as part of research projects have an incredible beauty, or sometimes by sheer luck, the timing is just right to show a unique moment in the life of a marine organism.
Zooplankton Research Program
Zooplankton research in the US AMLR Program focuses on the link between prey production, availability, and climate variability in relation to predator and fishery demands.