
Description of coastal employment:
The total coastal employment is the number of jobs in coastal communities. Businesses in coastal counties employ tens of millions of people nationally. This includes hundreds of thousands of ocean-dependent businesses that pay over $100 billion in wages annually. Many coastal and ocean amenities attracting visitors are free, generating no direct employment, wages, or gross domestic product. However, these “nonmarket” features are key drivers for many coastal businesses. We present data for all regions.
Data:
Coastal employment numbers were downloaded from the U.S. Bureau of Labor Statistics’ quarterly census of employment and wages, filtered to present only coastal county values using the Census Bureau’s list of coastal counties within each state. Of note is that these data fail to include self-employed individuals. Coastal county employment numbers were then summed within each region for reporting purposes.
Alaska
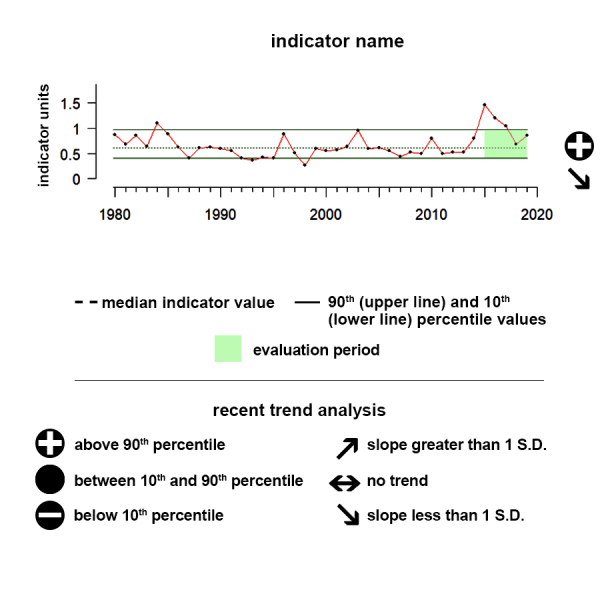
Description of time series:
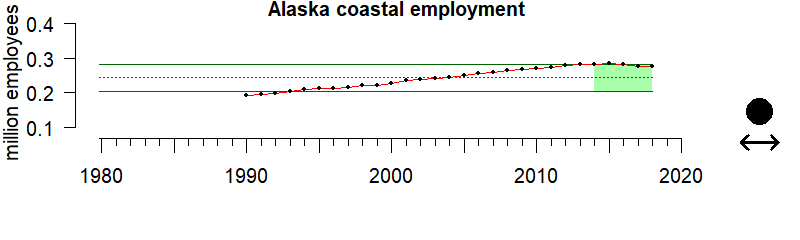
Alaska’s coastal employment has been relatively steady between 2014 - 2018, with no clear trend and no substantial difference from historical patterns.
Description of gauge:
The 2014 – 2018 average annual employment level in Alaska is greater than 85% of all employment levels between 1990 and 2018 in that state, indicating that employment levels over that period were high compared to historical levels.
Description of Coastal Employment:
Coastal employment numbers were downloaded from the U.S. Bureau of Labor Statistics’ quarterly census of employment and wages, filtered to present only coastal county values using the Census Bureau’s list of coastal counties within each state. Of note is that these data fail to include self-employed individuals. Coastal county employment numbers were then summed within each region for reporting purposes.
Extreme Gauge values:
A value of zero on the gauge means that the average coastal employment level over the last 5 years of data was below any annual employment level up until that point, while a value of 100 would indicate the average over that same period was above any annual employment level up until that point.
Data:
Coastal employment numbers were downloaded from the U.S. Bureau of Labor Statistics’ quarterly census of employment and wages, filtered to present only coastal county values using the Census Bureau’s list of coastal counties within each state. Of note is that these data fail to include self-employed individuals. Coastal county employment numbers were then summed within each region for reporting purposes.
Hawaiʻi-Pacific Islands
Description of time series:
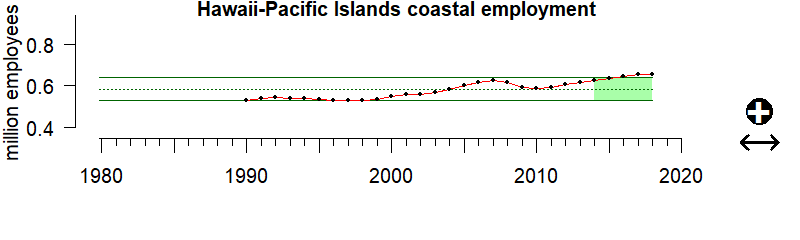
Hawaiʻi’s average coastal employment between 2014 and 2018 was substantially above historical levels, although no trend is apparent over that same period.
Description of gauge:
The 2014 – 2018 average annual employment level in Hawaiʻi is greater than 90% of all employment levels between 1990 and 2018, indicating that employment levels over that period were high compared to historical levels.
Description of Coastal Employment:
Coastal employment numbers were downloaded from the U.S. Bureau of Labor Statistics’ quarterly census of employment and wages, filtered to present only coastal county values using the Census Bureau’s list of coastal counties within each state. Of note is that these data fail to include self-employed individuals. Coastal county employment numbers were then summed within each region for reporting purposes.
Extreme Gauge values:
A value of zero on the gauge means that the average coastal employment level over the last 5 years of data was below any annual employment level up until that point, while a value of 100 would indicate the average over that same period was above any annual employment level up until that point.
Data:
Coastal employment numbers were downloaded from the U.S. Bureau of Labor Statistics’ quarterly census of employment and wages, filtered to present only coastal county values using the Census Bureau’s list of coastal counties within each state. Of note is that these data fail to include self-employed individuals. Coastal county employment numbers were then summed within each region for reporting purposes.
California Current
Description of time series:
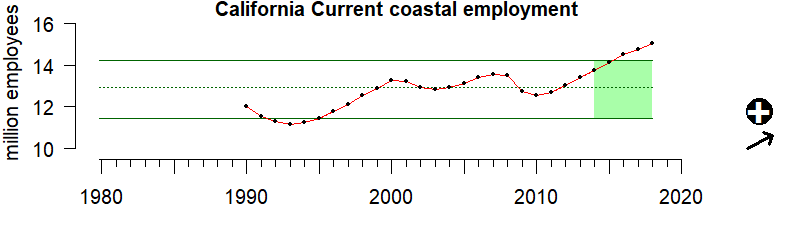
Average coastal employment in the California Current ecosystem between 2014 and 2018 was substantially above historical levels, with an increasing trend over that period.
Description of gauge:
The 2014 – 2018 average annual employment level in the California Current ecosystem is greater than 90% of all employment levels between 1990 and 2018, indicating that employment levels over that period were high compared to historical levels.
Description of Coastal Employment:
Coastal employment numbers were downloaded from the U.S. Bureau of Labor Statistics’ quarterly census of employment and wages, filtered to present only coastal county values using the Census Bureau’s list of coastal counties within each state. Of note is that these data fail to include self-employed individuals. Coastal county employment numbers were then summed within each region for reporting purposes.
Extreme Gauge values:
A value of zero on the gauge means that the average coastal employment level over the last 5 years of data was below any annual employment level up until that point, while a value of 100 would indicate the average over that same period was above any annual employment level up until that point.
Data:
Coastal employment numbers were downloaded from the U.S. Bureau of Labor Statistics’ quarterly census of employment and wages, filtered to present only coastal county values using the Census Bureau’s list of coastal counties within each state. Of note is that these data fail to include self-employed individuals. Coastal county employment numbers were then summed within each region for reporting purposes.
Gulf of Mexico
.
Description of time series:
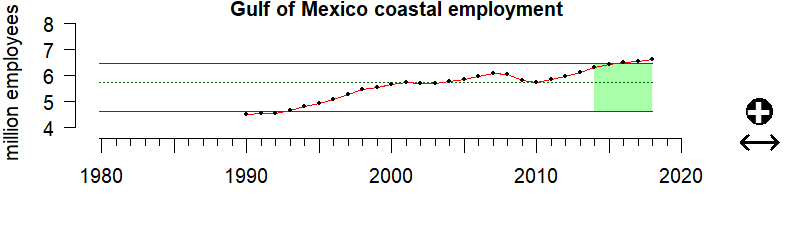
Average coastal employment along the Gulf of Mexico between 2014 and 2018 was substantially above historical levels, although no trend is apparent over that same period.
Description of gauge:
The 2014 – 2018 average annual employment level along the Gulf of Mexico is greater than 90% of all employment levels between 1990 and 2018, indicating that employment levels over that period were high compared to historical levels.
Description of Coastal Employment:
Coastal employment numbers were downloaded from the U.S. Bureau of Labor Statistics’ quarterly census of employment and wages, filtered to present only coastal county values using the Census Bureau’s list of coastal counties within each state. Of note is that these data fail to include self-employed individuals. Coastal county employment numbers were then summed within each region for reporting purposes.
Extreme Gauge values:
A value of zero on the gauge means that the average coastal employment level over the last 5 years of data was below any annual employment level up until that point, while a value of 100 would indicate the average over that same period was above any annual employment level up until that point.
Data:
Coastal employment numbers were downloaded from the U.S. Bureau of Labor Statistics’ quarterly census of employment and wages, filtered to present only coastal county values using the Census Bureau’s list of coastal counties within each state. Of note is that these data fail to include self-employed individuals. Coastal county employment numbers were then summed within each region for reporting purposes.
Caribbean
Description of time series:
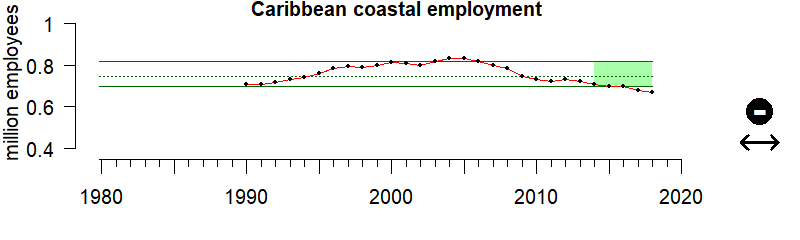
Average coastal employment within the U.S. Caribbean between 2014 and 2018 was substantially below historical levels, with a decreasing trend over that period.
Description of gauge:
The 2014 – 2018 average annual employment level within the U.S. Caribbean is higher than only 6% of all employment levels between 1990 and 2018, indicating that employment levels over that period were extremely low compared to historical levels.
Description of Coastal Employment:
Coastal employment numbers were downloaded from the U.S. Bureau of Labor Statistics’ quarterly census of employment and wages, filtered to present only coastal county values using the Census Bureau’s list of coastal counties within each state. Of note is that these data fail to include self-employed individuals. Coastal county employment numbers were then summed within each region for reporting purposes.
Extreme Gauge values:
A value of zero on the gauge means that the average coastal employment level over the last 5 years of data was below any annual employment level up until that point, while a value of 100 would indicate the average over that same period was above any annual employment level up until that point.
Data:
Coastal employment numbers were downloaded from the U.S. Bureau of Labor Statistics’ quarterly census of employment and wages, filtered to present only coastal county values using the Census Bureau’s list of coastal counties within each state. Of note is that these data fail to include self-employed individuals. Coastal county employment numbers were then summed within each region for reporting purposes.
Southeast
Description of time series:
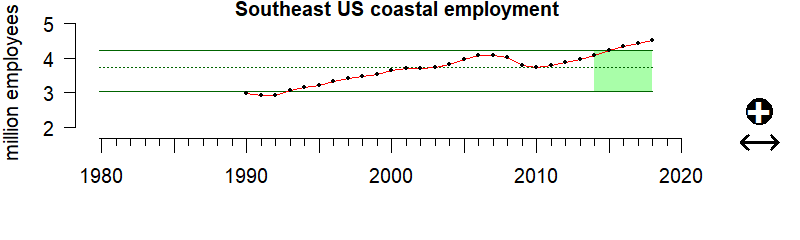
Average coastal employment within the Southeast between 2014 and 2018 was substantially above historical levels, although no trend is apparent over that same period.
Description of gauge:
The 2014 – 2018 average annual employment level within the Southeast is greater than 90% of all employment levels between 1990 and 2018, indicating that employment levels over that period were high compared to historical levels.
Description of Coastal Employment:
Coastal employment numbers were downloaded from the U.S. Bureau of Labor Statistics’ quarterly census of employment and wages, filtered to present only coastal county values using the Census Bureau’s list of coastal counties within each state. Of note is that these data fail to include self-employed individuals. Coastal county employment numbers were then summed within each region for reporting purposes.
Extreme Gauge values:
A value of zero on the gauge means that the average coastal employment level over the last 5 years of data was below any annual employment level up until that point, while a value of 100 would indicate the average over that same period was above any annual employment level up until that point.
Data:
Coastal employment numbers were downloaded from the U.S. Bureau of Labor Statistics’ quarterly census of employment and wages, filtered to present only coastal county values using the Census Bureau’s list of coastal counties within each state. Of note is that these data fail to include self-employed individuals. Coastal county employment numbers were then summed within each region for reporting purposes.
Northeast
Description of time series:
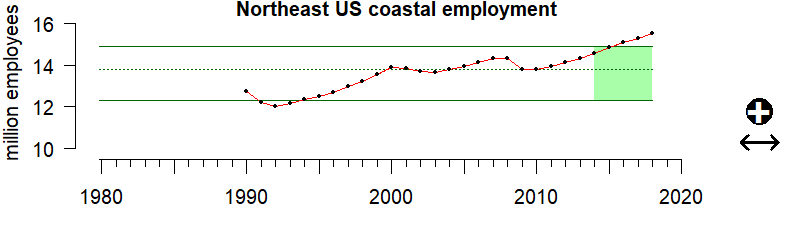
Average coastal employment within the Northeast between 2014 and 2018 was substantially above historical levels, although no trend is apparent over that same period.
Description of gauge:
The 2014 – 2018 average annual employment level within the Northeast is greater than 90% of all employment levels between 1990 and 2018, indicating that employment levels over that period were high compared to historical levels.
Description of Coastal Employment:
Coastal employment numbers were downloaded from the U.S. Bureau of Labor Statistics’ quarterly census of employment and wages, filtered to present only coastal county values using the Census Bureau’s list of coastal counties within each state. Of note is that these data fail to include self-employed individuals. Coastal county employment numbers were then summed within each region for reporting purposes.
Extreme Gauge values:
A value of zero on the gauge means that the average coastal employment level over the last 5 years of data was below any annual employment level up until that point, while a value of 100 would indicate the average over that same period was above any annual employment level up until that point.
Data:
Coastal employment numbers were downloaded from the U.S. Bureau of Labor Statistics’ quarterly census of employment and wages, filtered to present only coastal county values using the Census Bureau’s list of coastal counties within each state. Of note is that these data fail to include self-employed individuals. Coastal county employment numbers were then summed within each region for reporting purposes.
Resources
Socio-Cultural Dimensions
We conduct research to better understand the impacts of management decisions on our nation’s vital fishing communities. Each region creates fishing community profiles, which contain social and economic data. Social indicators are used to help assess community resilience and vulnerability.
Social Indicators Map
NOAA Fisheries developed social indicators to characterize community well-being for coastal communities engaged in fishing activities.
NOAA Economic National Ocean Watch data base
This report examines the critically important economic contributions of the oceans and Great Lakes. The report presents the NOAA Office for Coastal Management’s Economics: National Ocean Watch (ENOW) data set, and includes a variety of infographics at the national, regional, and state levels.
Economics: National Ocean Watch (ENOW) for Self-Employed Workers
This data set describes the self-employed workers whose jobs directly depend on the resources of the oceans and Great Lakes. Data are derived from Census Nonemployer Statistics and include the number of self-employed workers and gross receipts for the six sectors defined by ENOW. These time-series data are available at the national, regional, state, and county levels.